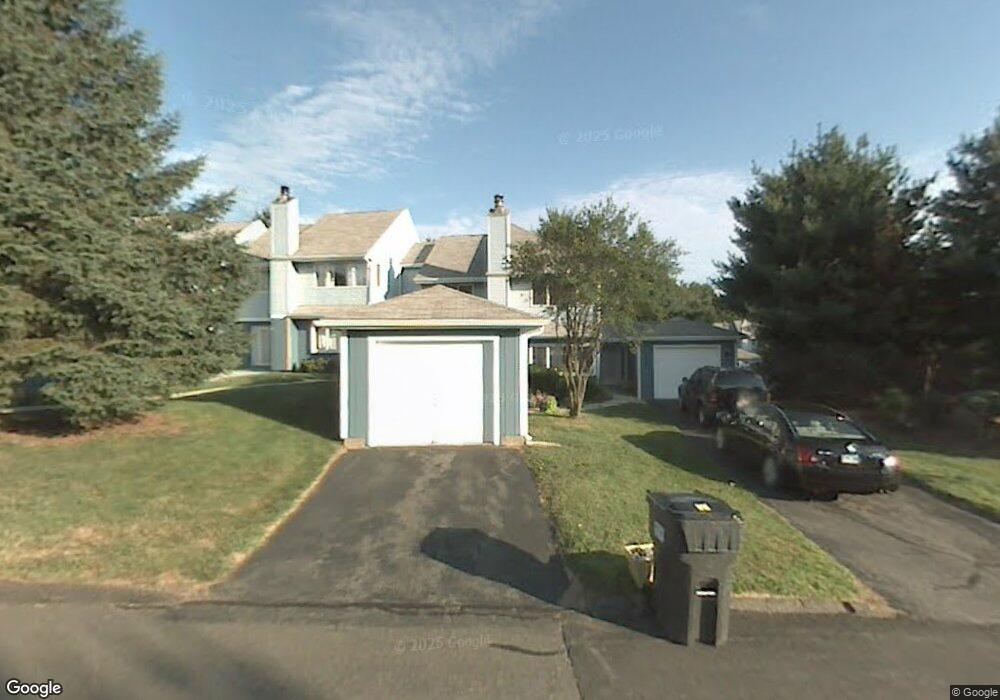
205 W Bass Ln Suffield, CT 06078
Estimated Value: $297,210 - $337,000
2
Beds
2
Baths
1,510
Sq Ft
$213/Sq Ft
Est. Value
About This Home
This home is located at 205 W Bass Ln, Suffield, CT 06078 and is currently estimated at $322,053, approximately $213 per square foot. 205 W Bass Ln is a home located in Hartford County with nearby schools including A. Ward Spaulding School, Mcalister Intermediate School, and Suffield Middle School.
Ownership History
Date
Name
Owned For
Owner Type
Purchase Details
Closed on
Jun 16, 2010
Sold by
Baker Jeffrey
Bought by
Lord Thomas
Current Estimated Value
Home Financials for this Owner
Home Financials are based on the most recent Mortgage that was taken out on this home.
Original Mortgage
$139,500
Outstanding Balance
$93,768
Interest Rate
5.03%
Estimated Equity
$228,285
Purchase Details
Closed on
Jul 29, 2004
Sold by
Savino Richard
Bought by
Baker Jeffrey
Home Financials for this Owner
Home Financials are based on the most recent Mortgage that was taken out on this home.
Original Mortgage
$142,400
Interest Rate
4.75%
Purchase Details
Closed on
Dec 15, 2003
Sold by
Welch Michael
Bought by
Savino Richard
Purchase Details
Closed on
Apr 2, 2002
Sold by
Zemeir Edwin and Zemeir Roslyn
Bought by
Welch Michael
Purchase Details
Closed on
Oct 15, 1998
Sold by
Ryan Allen and Ryan Catherine
Bought by
Zimeir Edwin and Zimeir Roslyn
Create a Home Valuation Report for This Property
The Home Valuation Report is an in-depth analysis detailing your home's value as well as a comparison with similar homes in the area
Home Values in the Area
Average Home Value in this Area
Purchase History
| Date | Buyer | Sale Price | Title Company |
|---|---|---|---|
| Lord Thomas | $186,000 | -- | |
| Baker Jeffrey | $178,000 | -- | |
| Savino Richard | $175,000 | -- | |
| Welch Michael | $145,000 | -- | |
| Zimeir Edwin | $100,000 | -- |
Source: Public Records
Mortgage History
| Date | Status | Borrower | Loan Amount |
|---|---|---|---|
| Open | Zimeir Edwin | $139,500 | |
| Previous Owner | Zimeir Edwin | $137,000 | |
| Previous Owner | Zimeir Edwin | $142,400 |
Source: Public Records
Tax History Compared to Growth
Tax History
| Year | Tax Paid | Tax Assessment Tax Assessment Total Assessment is a certain percentage of the fair market value that is determined by local assessors to be the total taxable value of land and additions on the property. | Land | Improvement |
|---|---|---|---|---|
| 2025 | $3,517 | $150,220 | $0 | $150,220 |
| 2024 | $3,399 | $150,220 | $0 | $150,220 |
| 2023 | $3,152 | $110,180 | $0 | $110,180 |
| 2022 | $3,152 | $110,180 | $0 | $110,180 |
| 2021 | $3,156 | $110,180 | $0 | $110,180 |
| 2020 | $3,156 | $110,180 | $0 | $110,180 |
| 2019 | $3,164 | $110,180 | $0 | $110,180 |
| 2018 | $3,352 | $114,310 | $0 | $114,310 |
| 2017 | $3,302 | $114,310 | $0 | $114,310 |
| 2016 | $3,224 | $114,310 | $0 | $114,310 |
| 2015 | $3,176 | $114,310 | $0 | $114,310 |
| 2014 | $3,100 | $114,310 | $0 | $114,310 |
Source: Public Records
Map
Nearby Homes
- 176 Dusky Ln Unit 176
- 120 E Bluegill Ln Unit 120
- 21 Pebblestone Cir
- 29 Primrose Ln
- 45 Douglas St
- 20 Greendale Dr
- 17 Woodworth St
- 32 Cottage Green
- 12 Thompson Ct
- 54 Prospect St
- 69 Prospect St
- 20 Walnut St
- 88 High St
- 18 Central St
- 57 Kildeer Ln
- 8 Frew Terrace
- 3 Martin St
- 53 New King St
- 33 Frew Terrace
- 1070 Enfield St
- 203 W Bass Ln
- 205 W Bass Ln Unit 205
- 181 W Bass Ln
- 181 W Bass Ln Unit 181
- 183 W Bass Ln
- 183 W Bass Ln Unit 183
- 197 W Bass Ln
- 189 W Bass Ln
- 187 W Bass Ln
- 185 W Bass Ln
- 201 W Bass Ln
- 199 W Bass Ln
- 195 W Bass Ln
- 193 W Bass Ln
- 191 W Bass Ln
- 199 W Bass Ln Unit 199
- 195 W Bass Ln Unit 195
- 189 W Bass Ln Unit 189
- 197 W Bass Ln Unit 197
- 163 Coho Ln