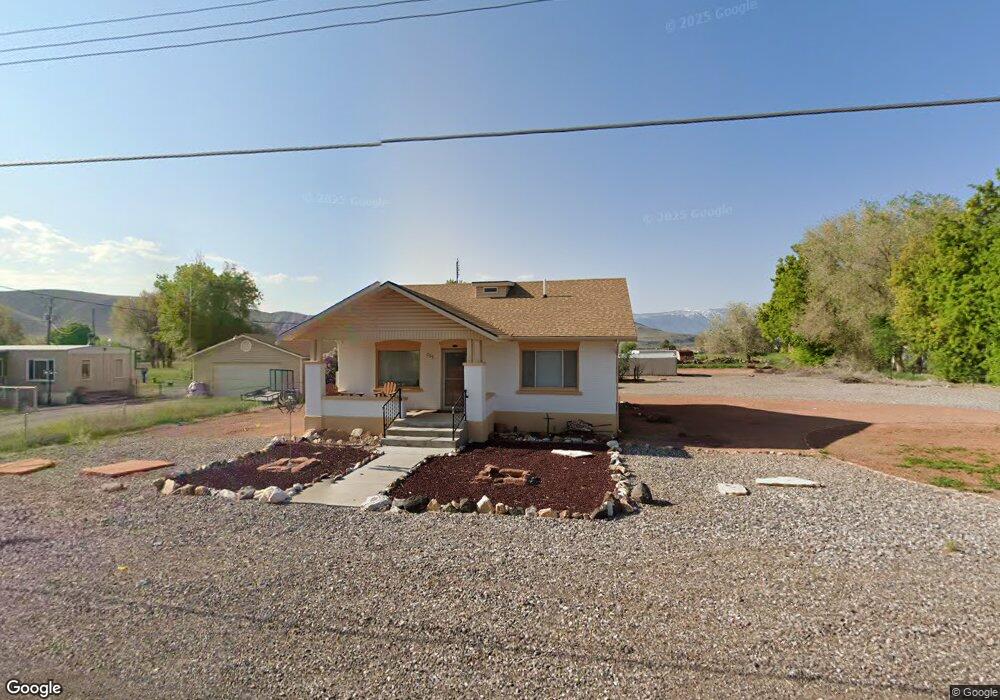
205 W Center St Sigurd, UT 84657
Estimated Value: $269,236 - $361,000
2
Beds
2
Baths
1,352
Sq Ft
$225/Sq Ft
Est. Value
About This Home
This home is located at 205 W Center St, Sigurd, UT 84657 and is currently estimated at $303,559, approximately $224 per square foot. 205 W Center St is a home located in Sevier County with nearby schools including Pahvant School, Ashman School, and Red Hills Middle School.
Ownership History
Date
Name
Owned For
Owner Type
Purchase Details
Closed on
Oct 22, 2015
Sold by
Tribe Robert O and Tribe Claudie J
Bought by
Gerke Jennifer M
Current Estimated Value
Home Financials for this Owner
Home Financials are based on the most recent Mortgage that was taken out on this home.
Original Mortgage
$87,000
Outstanding Balance
$68,381
Interest Rate
3.85%
Estimated Equity
$235,178
Purchase Details
Closed on
Dec 28, 2010
Sold by
Tribe Robert O and Tribe Claudia J
Bought by
Tribe Robert O and Tribe Claudia J
Home Financials for this Owner
Home Financials are based on the most recent Mortgage that was taken out on this home.
Original Mortgage
$151,500
Interest Rate
4.34%
Mortgage Type
Reverse Mortgage Home Equity Conversion Mortgage
Purchase Details
Closed on
Mar 1, 2008
Sold by
Boyter Brad G
Bought by
Tribe Robet O and Tribe Claudia J
Home Financials for this Owner
Home Financials are based on the most recent Mortgage that was taken out on this home.
Original Mortgage
$45,000
Interest Rate
5.65%
Mortgage Type
Purchase Money Mortgage
Create a Home Valuation Report for This Property
The Home Valuation Report is an in-depth analysis detailing your home's value as well as a comparison with similar homes in the area
Home Values in the Area
Average Home Value in this Area
Purchase History
| Date | Buyer | Sale Price | Title Company |
|---|---|---|---|
| Gerke Jennifer M | -- | First American Title Insuran | |
| Tribe Robert O | -- | -- | |
| Tribe Robet O | -- | First Ameican Title Insuranc |
Source: Public Records
Mortgage History
| Date | Status | Borrower | Loan Amount |
|---|---|---|---|
| Open | Gerke Jennifer M | $87,000 | |
| Previous Owner | Tribe Robert O | $151,500 | |
| Previous Owner | Tribe Robet O | $45,000 |
Source: Public Records
Tax History Compared to Growth
Tax History
| Year | Tax Paid | Tax Assessment Tax Assessment Total Assessment is a certain percentage of the fair market value that is determined by local assessors to be the total taxable value of land and additions on the property. | Land | Improvement |
|---|---|---|---|---|
| 2024 | $2,047 | $234,346 | $45,897 | $188,449 |
| 2023 | $2,133 | $239,865 | $43,858 | $196,007 |
| 2022 | $2,045 | $204,080 | $38,674 | $165,406 |
| 2021 | $2,254 | $189,015 | $38,674 | $150,341 |
| 2020 | $1,635 | $127,821 | $23,762 | $104,059 |
| 2019 | $1,479 | $123,510 | $23,760 | $99,750 |
| 2018 | $1,490 | $110,910 | $22,630 | $88,280 |
| 2017 | $1,492 | $106,310 | $22,630 | $83,680 |
| 2016 | $586 | $101,180 | $0 | $0 |
| 2015 | $586 | $53,480 | $0 | $0 |
| 2014 | $586 | $50,020 | $0 | $0 |
Source: Public Records
Map
Nearby Homes
- 180 N State St
- 701 S Black Knoll Rd Unit 4
- 1898 N Rocky Ford Dr
- 2220 N State St Unit 14
- 1800 N Vermillion Canal Rd
- 575 S 205 W
- 1526 N Black Knoll Rd
- 154 E 950 N
- 680 E 300 S Unit 110
- 310 W 800 S Unit 106
- 330 W 800 S Unit 105
- 2203 S 1770 W Unit 1
- 2200 N Hwy 260 (Approximately) W
- 140 N 200 E
- 2330 2650 E
- 255 E 100 N
- 40 S Main St
- 60 S Main St
- 155 W 350 S
- 122 S 500 W
- 185 W Center St
- 233 W Center St
- 202 W Center St
- 218 W Center St
- 234 W Center St
- 182 W Center St
- 248 W Center St
- 154 W Center St
- 150 W Center St
- 262 W Center St
- 98 S Main St
- 270 W Center St
- 249 W 60 N
- 110 W Center St
- 297 W Center St
- 298 W Center St
- 81 S Main St
- 113 S Main St
- 322 W Center St
- 32 S Main St