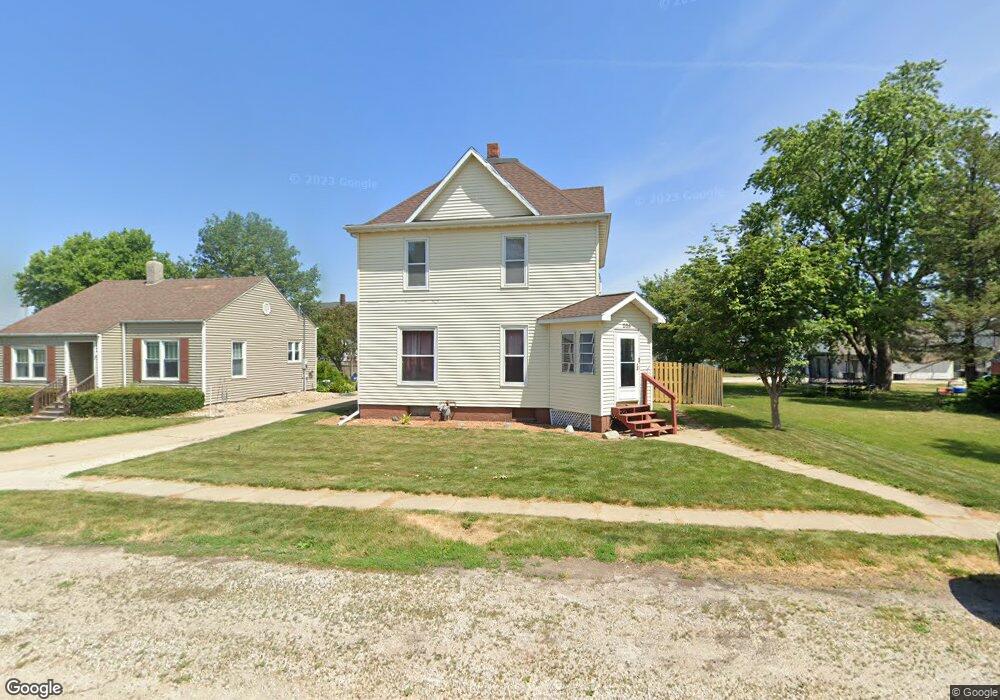
205 W Franklin St Carlock, IL 61725
Estimated Value: $118,000 - $221,000
--
Bed
1
Bath
1,092
Sq Ft
$148/Sq Ft
Est. Value
About This Home
This home is located at 205 W Franklin St, Carlock, IL 61725 and is currently estimated at $161,552, approximately $147 per square foot. 205 W Franklin St is a home located in McLean County with nearby schools including Carlock Elementary School, Parkside Junior High School, and Normal Community West High School.
Ownership History
Date
Name
Owned For
Owner Type
Purchase Details
Closed on
Jun 6, 2023
Sold by
Luebke Arthur Christopher
Bought by
Luebke Family Trust and Luebke
Current Estimated Value
Purchase Details
Closed on
Apr 2, 2010
Sold by
Luebke Arthur Steven
Bought by
Luebke Arthur Christopher
Home Financials for this Owner
Home Financials are based on the most recent Mortgage that was taken out on this home.
Original Mortgage
$104,703
Interest Rate
5.1%
Purchase Details
Closed on
Aug 13, 2009
Sold by
Bible Tracts Inc
Bought by
Luebke Arthur Steven
Purchase Details
Closed on
Aug 14, 2007
Sold by
Ratajski Theodore H and Ratajski Christina L
Bought by
Luebke Arthur Steven
Purchase Details
Closed on
Jun 8, 2006
Sold by
Bible Tracts Inc
Bought by
Ratajski Theodore H and Ratajski Christina L
Create a Home Valuation Report for This Property
The Home Valuation Report is an in-depth analysis detailing your home's value as well as a comparison with similar homes in the area
Home Values in the Area
Average Home Value in this Area
Purchase History
| Date | Buyer | Sale Price | Title Company |
|---|---|---|---|
| Luebke Family Trust | -- | None Listed On Document | |
| Luebke Arthur Christopher | $102,500 | None Available | |
| Luebke Arthur Steven | -- | None Available | |
| Luebke Arthur Steven | $53,000 | None Available | |
| Ratajski Theodore H | -- | Mclean County Title |
Source: Public Records
Mortgage History
| Date | Status | Borrower | Loan Amount |
|---|---|---|---|
| Previous Owner | Luebke Arthur Christopher | $104,703 |
Source: Public Records
Tax History Compared to Growth
Tax History
| Year | Tax Paid | Tax Assessment Tax Assessment Total Assessment is a certain percentage of the fair market value that is determined by local assessors to be the total taxable value of land and additions on the property. | Land | Improvement |
|---|---|---|---|---|
| 2024 | $2,498 | $44,115 | $5,411 | $38,704 |
| 2022 | $2,498 | $36,130 | $4,431 | $31,699 |
| 2021 | $2,295 | $33,138 | $4,064 | $29,074 |
| 2020 | $2,230 | $32,226 | $3,952 | $28,274 |
| 2019 | $2,049 | $30,930 | $3,793 | $27,137 |
| 2018 | $2,567 | $30,566 | $3,748 | $26,818 |
| 2017 | $2,443 | $29,682 | $3,640 | $26,042 |
| 2016 | $2,423 | $29,682 | $3,640 | $26,042 |
| 2015 | $2,389 | $29,292 | $3,592 | $25,700 |
| 2014 | $1,160 | $14,362 | $3,592 | $10,770 |
| 2013 | -- | $14,773 | $3,695 | $11,078 |
Source: Public Records
Map
Nearby Homes
- 14 Boulder Dr
- 12 Boulder Dr
- 15 Boulder Dr
- 9 Boulder Dr
- 4 Sandstone Ave
- 4 Cobblestone Ave
- 297 MacAllen Lake Rd
- 408 N West St
- 209 N West St
- 114 W North St
- 493 Reaba Ave
- 254 County Road 2500 E
- 254 County Rd 2500e
- 9491 Crossbow Dr
- 8468 Carriage Hills Rd
- 14345 N 900 East Rd
- 14089 Jean Trace
- 9030 Hardesty Run
- 2012 County Road 600 N
- 2009 Marina Dr
- 205 W Franklin St
- 207 W Franklin St
- 209 W Franklin St
- 206 W Washington St
- 201 W Franklin St
- 206 W Washington St
- 206 W Franklin St
- 204 W Franklin St
- 208 W Washington St
- 202 W Franklin St Unit 16
- 205 W Washington St
- 109 W Franklin St
- 205 W Washington St
- 104 W Washington St
- 110 W Franklin St
- 201 W Washington St
- 105 W Franklin St
- 402 W Washington St
- 108 W Franklin St
- 102 W Washington St