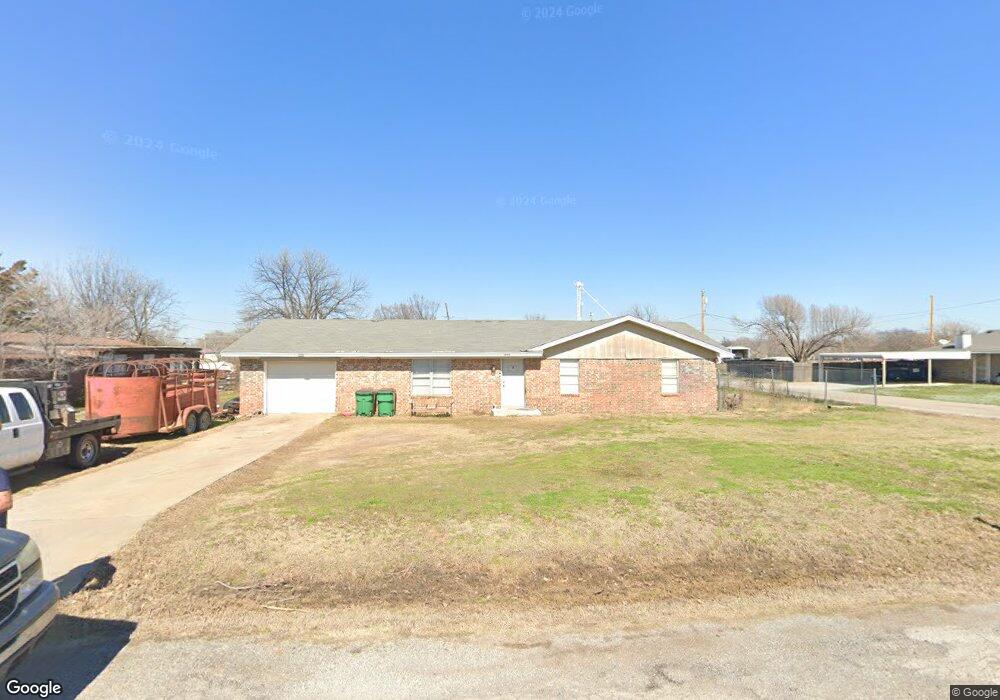
205 W Virginia St Walters, OK 73572
Estimated Value: $58,000 - $116,000
3
Beds
2
Baths
1,274
Sq Ft
$78/Sq Ft
Est. Value
About This Home
This home is located at 205 W Virginia St, Walters, OK 73572 and is currently estimated at $98,769, approximately $77 per square foot. 205 W Virginia St is a home located in Cotton County with nearby schools including Walters Elementary School, Walters Middle School, and Walters High School.
Ownership History
Date
Name
Owned For
Owner Type
Purchase Details
Closed on
Apr 19, 2024
Sold by
Alves David and Alves Joanna
Bought by
Medcalf Michael Christopher and Medcalf Bree Anna
Current Estimated Value
Home Financials for this Owner
Home Financials are based on the most recent Mortgage that was taken out on this home.
Original Mortgage
$37,197
Outstanding Balance
$36,591
Interest Rate
6.74%
Mortgage Type
New Conventional
Estimated Equity
$62,178
Purchase Details
Closed on
Apr 17, 2024
Sold by
Philpott Kristi and Philpott Kristie
Bought by
Medcalf Michael Christopher and Medcalf Bree Anna
Home Financials for this Owner
Home Financials are based on the most recent Mortgage that was taken out on this home.
Original Mortgage
$37,197
Outstanding Balance
$36,591
Interest Rate
6.74%
Mortgage Type
New Conventional
Estimated Equity
$62,178
Purchase Details
Closed on
Dec 16, 2022
Sold by
Larson Glasgow Betty Lou
Bought by
Alves David and Alves Joanna
Create a Home Valuation Report for This Property
The Home Valuation Report is an in-depth analysis detailing your home's value as well as a comparison with similar homes in the area
Home Values in the Area
Average Home Value in this Area
Purchase History
| Date | Buyer | Sale Price | Title Company |
|---|---|---|---|
| Medcalf Michael Christopher | $42,500 | Sovereign Title Services | |
| Medcalf Michael Christopher | -- | Sovereign Title Services | |
| Alves David | -- | -- |
Source: Public Records
Mortgage History
| Date | Status | Borrower | Loan Amount |
|---|---|---|---|
| Open | Medcalf Michael Christopher | $37,197 |
Source: Public Records
Tax History Compared to Growth
Tax History
| Year | Tax Paid | Tax Assessment Tax Assessment Total Assessment is a certain percentage of the fair market value that is determined by local assessors to be the total taxable value of land and additions on the property. | Land | Improvement |
|---|---|---|---|---|
| 2025 | $913 | $9,540 | $495 | $9,045 |
| 2024 | $913 | $10,466 | $495 | $9,971 |
| 2023 | $671 | $7,690 | $495 | $7,195 |
| 2022 | $633 | $7,324 | $495 | $6,829 |
| 2021 | $544 | $7,324 | $495 | $6,829 |
| 2020 | $555 | $7,472 | $495 | $6,977 |
| 2019 | $599 | $7,224 | $487 | $6,737 |
| 2018 | $572 | $6,880 | $471 | $6,409 |
| 2017 | $546 | $6,553 | $440 | $6,113 |
| 2016 | $520 | $6,241 | $420 | $5,821 |
| 2015 | $498 | $5,944 | $366 | $5,578 |
| 2014 | $465 | $5,510 | $344 | $5,166 |
Source: Public Records
Map
Nearby Homes
- 309 W Ohio St
- 401 Virginia Ave
- 121 E Texas St
- 227 E Ohio St
- 103 Thurman Dr
- 206 E Nebraska Ave
- 411 W Nebraska Ave
- 230 W Colorado St
- 227 E California St
- 619 E South Boundary St
- 221 W Kansas St
- 308 Willow Creek Dr
- 602 Tramel Cir
- 321 N 3rd St
- 303 E Oklahoma St
- 505 E Kansas Ave
- 500 E Iowa St
- 000 N 2620 Rd
- 130 Stardust Cir
- 180000 N 2600 Rd
- 127 W Virginia St
- 202 W Ohio St
- 210 W Ohio St
- 202 W Virginia St
- 206 W Virginia St
- 816 S 6th St
- 117 W Virginia St
- 208 W Virginia St
- 212 W Virginia St
- 113 W Virginia St
- 124 W Virginia St
- 224 W Virginia St
- 109 W Virginia St
- 201 W Ohio St
- 201 W Wyoming St
- 203 W Wyoming St
- 729 S 5th St
- 220 W Virginia St
- 211 W Wyoming St
- 215 W Ohio St