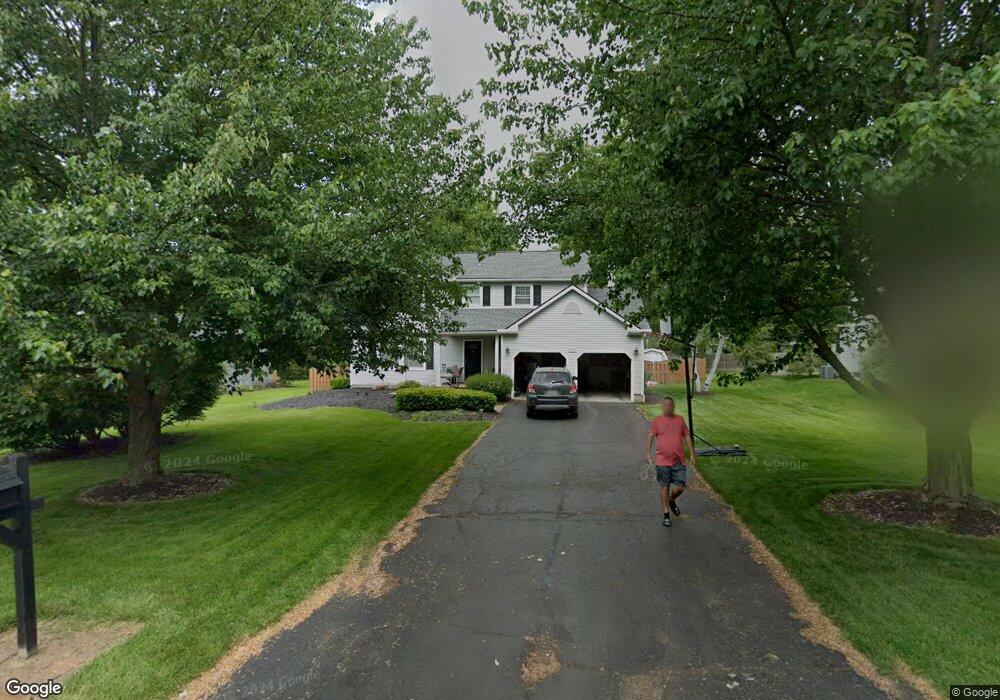
205 Wae Trail Cortland, OH 44410
Estimated Value: $281,260 - $329,000
4
Beds
3
Baths
1,872
Sq Ft
$160/Sq Ft
Est. Value
About This Home
This home is located at 205 Wae Trail, Cortland, OH 44410 and is currently estimated at $299,565, approximately $160 per square foot. 205 Wae Trail is a home located in Trumbull County with nearby schools including Lakeview Elementary School, Lakeview Middle School, and Lakeview High School.
Ownership History
Date
Name
Owned For
Owner Type
Purchase Details
Closed on
Aug 15, 2005
Sold by
Clancy Christopher P and Clancy Jennifer J
Bought by
Gough Bryan T and Gough Karen L
Current Estimated Value
Purchase Details
Closed on
May 7, 1997
Sold by
Elias Matthew T and Elias Leslie L
Bought by
Clancy Christopher P and Clancy Jennifer J
Purchase Details
Closed on
Jul 22, 1994
Sold by
Morvay David A
Bought by
Matthew T Elias
Home Financials for this Owner
Home Financials are based on the most recent Mortgage that was taken out on this home.
Original Mortgage
$109,000
Interest Rate
8.38%
Mortgage Type
New Conventional
Purchase Details
Closed on
Jan 1, 1990
Bought by
David David A and David S
Create a Home Valuation Report for This Property
The Home Valuation Report is an in-depth analysis detailing your home's value as well as a comparison with similar homes in the area
Home Values in the Area
Average Home Value in this Area
Purchase History
| Date | Buyer | Sale Price | Title Company |
|---|---|---|---|
| Gough Bryan T | $167,000 | -- | |
| Clancy Christopher P | $155,500 | -- | |
| Matthew T Elias | $136,500 | -- | |
| David David A | -- | -- |
Source: Public Records
Mortgage History
| Date | Status | Borrower | Loan Amount |
|---|---|---|---|
| Previous Owner | Matthew T Elias | $109,000 | |
| Closed | Clancy Christopher P | -- |
Source: Public Records
Tax History Compared to Growth
Tax History
| Year | Tax Paid | Tax Assessment Tax Assessment Total Assessment is a certain percentage of the fair market value that is determined by local assessors to be the total taxable value of land and additions on the property. | Land | Improvement |
|---|---|---|---|---|
| 2024 | $4,195 | $82,110 | $10,220 | $71,890 |
| 2023 | $4,276 | $82,110 | $10,220 | $71,890 |
| 2022 | $3,494 | $55,730 | $9,280 | $46,450 |
| 2021 | $3,508 | $55,730 | $9,280 | $46,450 |
| 2020 | $3,526 | $55,730 | $9,280 | $46,450 |
| 2019 | $3,288 | $50,760 | $9,280 | $41,480 |
| 2018 | $3,302 | $50,760 | $9,280 | $41,480 |
| 2017 | $3,298 | $50,760 | $9,280 | $41,480 |
| 2016 | $3,255 | $48,410 | $10,050 | $38,360 |
| 2015 | $3,242 | $48,410 | $10,050 | $38,360 |
| 2014 | $2,851 | $48,410 | $10,050 | $38,360 |
| 2013 | $2,902 | $48,410 | $10,050 | $38,360 |
Source: Public Records
Map
Nearby Homes
- 220 Wae Trail
- 229 Greenbriar Dr
- 300 Wae Trail
- 211 Natale Dr
- 314 Deer Creek Trail
- 266 Corriedale Dr
- 2730 Wilson Sharpsville Rd
- 298 Corriedale Dr
- 297 Corriedale Dr
- 3233 Niles Cortland Rd NE
- VL #7 Maplewood
- 3454 Warren Meadville Rd
- VL #8 Maplewood
- 3438 Warren Meadville Rd
- 19 Spring Creek Dr
- 105 Diamond Way Unit 105
- 2 Bayview Cir
- 232 Bayview Dr Unit 232
- 151 Cedar Cir
- 167 S Mecca St
- 209 Wae Trail
- 201 Wae Trail
- 204 Terre Hill Dr
- 208 Terre Hill Dr
- 213 Wae Trail
- 200 Terre Hill Dr
- 204 Wae Trail
- 212 Terre Hill Dr
- 212 Wae Trail
- 217 Wae Trail
- 817 Lakeview Dr
- 216 Wae Trail
- 216 Terre Hill Dr
- 813 Lakeview Dr
- 200 Wae Trail
- 821 Lakeview Dr
- 205 Terre Hill Dr
- 221 Wae Trail
- 809 Lakeview Dr
- 209 Terre Hill Dr