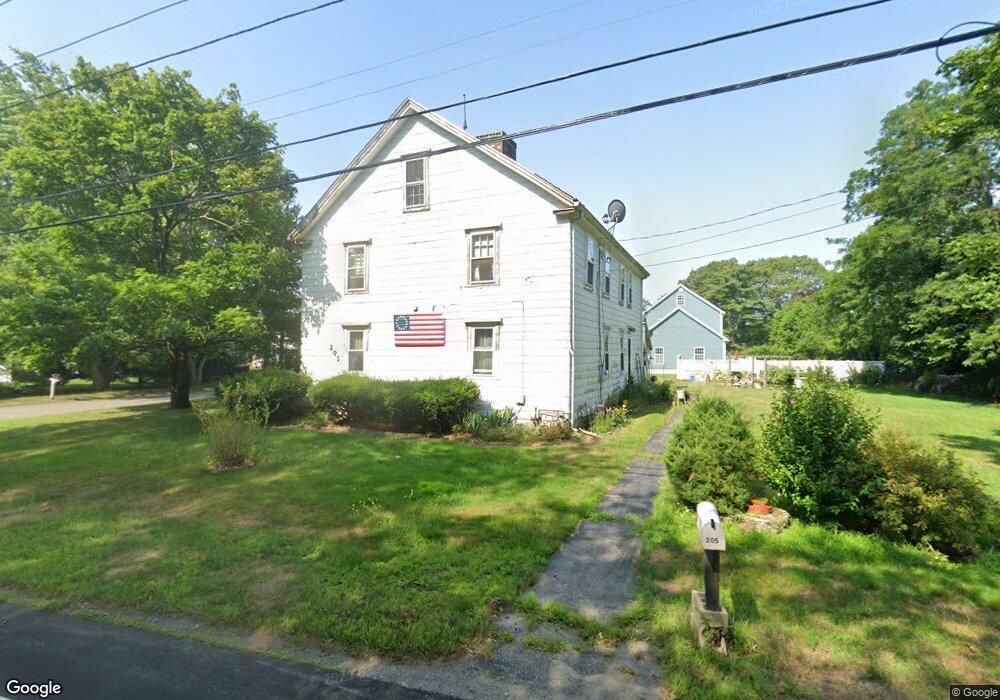
205 Warren Ave Seekonk, MA 02771
Monroes-South Seekonk NeighborhoodEstimated Value: $455,000 - $628,000
4
Beds
1
Bath
2,128
Sq Ft
$263/Sq Ft
Est. Value
About This Home
This home is located at 205 Warren Ave, Seekonk, MA 02771 and is currently estimated at $558,790, approximately $262 per square foot. 205 Warren Ave is a home located in Bristol County with nearby schools including Seekonk High School, St Mary Academy-Bay View, and Providence Country Day School.
Ownership History
Date
Name
Owned For
Owner Type
Purchase Details
Closed on
Dec 1, 1995
Sold by
Marnoch Claire D and Marnock Claire Dorothy
Bought by
Smith Timothy G
Current Estimated Value
Home Financials for this Owner
Home Financials are based on the most recent Mortgage that was taken out on this home.
Original Mortgage
$84,550
Interest Rate
7.37%
Mortgage Type
Purchase Money Mortgage
Create a Home Valuation Report for This Property
The Home Valuation Report is an in-depth analysis detailing your home's value as well as a comparison with similar homes in the area
Home Values in the Area
Average Home Value in this Area
Purchase History
| Date | Buyer | Sale Price | Title Company |
|---|---|---|---|
| Smith Timothy G | $89,000 | -- |
Source: Public Records
Mortgage History
| Date | Status | Borrower | Loan Amount |
|---|---|---|---|
| Open | Smith Timothy G | $168,800 | |
| Closed | Smith Timothy G | $12,777 | |
| Closed | Smith Timothy G | $11,013 | |
| Closed | Smith Timothy G | $84,550 |
Source: Public Records
Tax History
| Year | Tax Paid | Tax Assessment Tax Assessment Total Assessment is a certain percentage of the fair market value that is determined by local assessors to be the total taxable value of land and additions on the property. | Land | Improvement |
|---|---|---|---|---|
| 2025 | $5,327 | $431,300 | $159,500 | $271,800 |
| 2024 | $5,093 | $412,400 | $159,500 | $252,900 |
| 2023 | $4,536 | $346,000 | $142,500 | $203,500 |
| 2022 | $4,158 | $311,700 | $136,900 | $174,800 |
| 2021 | $3,899 | $291,700 | $121,200 | $170,500 |
| 2020 | $3,822 | $282,600 | $121,300 | $161,300 |
| 2019 | $3,588 | $274,700 | $121,300 | $153,400 |
| 2018 | $3,100 | $265,300 | $121,300 | $144,000 |
| 2017 | $3,392 | $252,000 | $116,100 | $135,900 |
| 2016 | $3,340 | $249,100 | $116,100 | $133,000 |
| 2015 | $3,249 | $245,600 | $116,100 | $129,500 |
Source: Public Records
Map
Nearby Homes
- 7 Jill Ct
- 34 Palmer River Rd
- 85 Hospital Rd
- 3 Pine Top Rd
- 0 Pinetop Rd
- 1741 Wampanoag Trail
- 6 Hazelton Rd
- 0 N Wheaton Ave
- 11 Hawthorne Dr
- 195 Barney Ave
- 22 Grassy Plain Rd
- 15 George w Finnerty Rd
- 367 New Meadow Rd
- 57 Mohawk Dr
- 454 Fall River Ave
- 155 Sagamore Rd
- 0 Sagamore Rd
- 14 Benedict St
- 14 Winthrop St
- 47 Dartmouth Ave
Your Personal Tour Guide
Ask me questions while you tour the home.