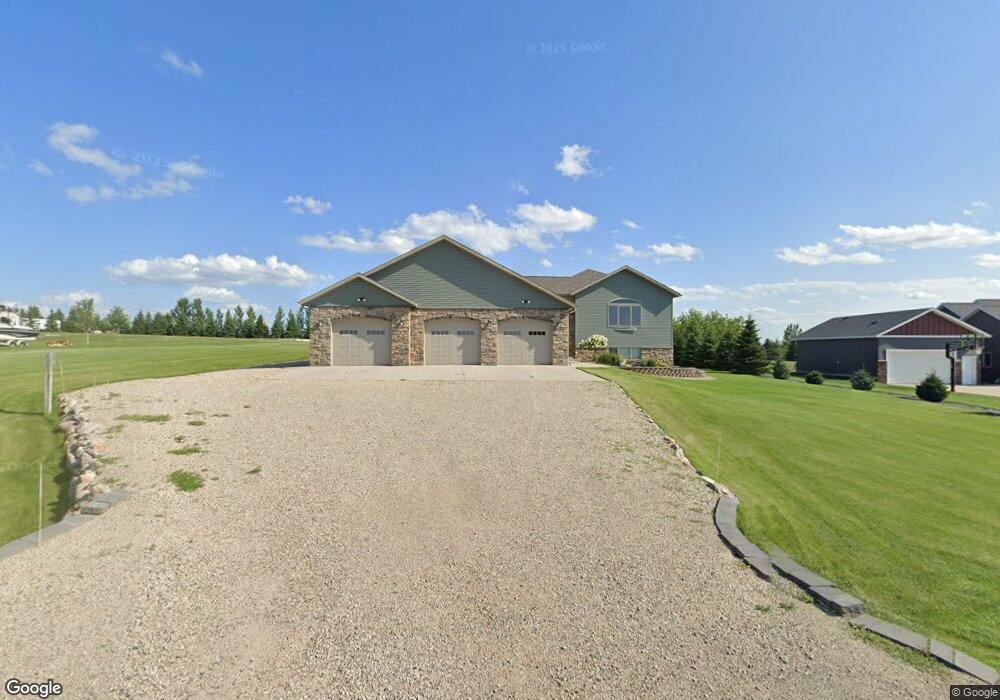
205 Watercress Ave Bismarck, ND 58503
Estimated Value: $537,000 - $785,000
Studio
--
Bath
2,300
Sq Ft
$265/Sq Ft
Est. Value
About This Home
This home is located at 205 Watercress Ave, Bismarck, ND 58503 and is currently estimated at $609,670, approximately $265 per square foot. 205 Watercress Ave is a home with nearby schools including Liberty Elementary School, Horizon Middle School, and Century High School.
Ownership History
Date
Name
Owned For
Owner Type
Purchase Details
Closed on
May 4, 2020
Sold by
Shillingstad Jason and Shillingstad Meagan
Bought by
Shillingstad Properties Llc
Current Estimated Value
Home Financials for this Owner
Home Financials are based on the most recent Mortgage that was taken out on this home.
Original Mortgage
$373,500
Outstanding Balance
$250,943
Interest Rate
3.5%
Mortgage Type
New Conventional
Estimated Equity
$358,727
Purchase Details
Closed on
Jan 30, 2015
Sold by
Pinnacle Homes Inc
Bought by
Steiner Andrew A and Steiner Amy J
Home Financials for this Owner
Home Financials are based on the most recent Mortgage that was taken out on this home.
Original Mortgage
$417,000
Interest Rate
3.85%
Mortgage Type
New Conventional
Purchase Details
Closed on
Jul 11, 2014
Sold by
Steiner Andrew A and Steiner Amy J
Bought by
Pinnacle Homes Inc
Purchase Details
Closed on
Nov 21, 2013
Sold by
Felton Developing Inc
Bought by
Steiner Andrew A and Steiner Amy J
Create a Home Valuation Report for This Property
The Home Valuation Report is an in-depth analysis detailing your home's value as well as a comparison with similar homes in the area
Purchase History
| Date | Buyer | Sale Price | Title Company |
|---|---|---|---|
| Shillingstad Properties Llc | -- | None Available | |
| Steiner Andrew A | -- | None Available | |
| Pinnacle Homes Inc | -- | Bismarck Title Co | |
| Steiner Andrew A | $74,900 | Bismarck Title Co |
Source: Public Records
Mortgage History
| Date | Status | Borrower | Loan Amount |
|---|---|---|---|
| Open | Shillingstad Properties Llc | $373,500 | |
| Closed | Steiner Andrew A | $417,000 |
Source: Public Records
Tax History
| Year | Tax Paid | Tax Assessment Tax Assessment Total Assessment is a certain percentage of the fair market value that is determined by local assessors to be the total taxable value of land and additions on the property. | Land | Improvement |
|---|---|---|---|---|
| 2025 | $3,349 | $339,450 | $0 | $0 |
| 2024 | $4,685 | $316,700 | $0 | $0 |
| 2023 | $4,983 | $301,550 | $0 | $0 |
| 2022 | $4,008 | $265,350 | $0 | $0 |
| 2021 | $4,006 | $252,250 | $0 | $0 |
| 2020 | $3,323 | $208,100 | $0 | $0 |
| 2019 | $3,305 | $204,750 | $0 | $0 |
| 2018 | $3,025 | $204,750 | $33,000 | $171,750 |
| 2017 | $2,949 | $204,750 | $171,750 | $33,000 |
| 2016 | $2,949 | $204,750 | $33,000 | $171,750 |
| 2014 | -- | $39,600 | $39,600 | $0 |
Source: Public Records
Map
Nearby Homes
- 1001 Sunflower Dr
- 600 79th Ave NE
- Tbd State Highway 83
- 8843 Welle Loop
- 14140 Paniolo Way
- Tbd 52nd St NE
- 10750 Rushmore Rd
- 11809 Glacier Cir
- 17007 Acadia Dr
- 18008 Acadia Dr
- 17003 Acadia Dr
- 18009 Acadia Dr
- 16007 Acadia Dr
- 17010 Acadia Dr
- 16008 Acadia Dr
- 16010 Acadia Dr
- 11711 Redwood Rd
- 17004 Acadia Dr
- 19003 Acadia Dr
- 20005 Acadia Place
- 115 Watercress Ave
- 217 Watercress Ave
- 126 Watercress Ave
- 102 Watercress Ave
- 103 Watercress Ave
- 9200 Pepper Cir
- 108 90th Ave NE
- 9201 Pepper Cir
- 212 90th Ave NE
- 206 90th Ave NE
- 9102 Coriander Dr
- 200 90th Ave NE
- 302 90th Ave NE
- 9010 Coriander Dr
- 9204 Coriander Dr
- 310 90th Ave NE
- 100 90th Ave NE
- 306 Watercress Ave
- 9000 Coriander Dr
- 318 Watercress Ave
Your Personal Tour Guide
Ask me questions while you tour the home.