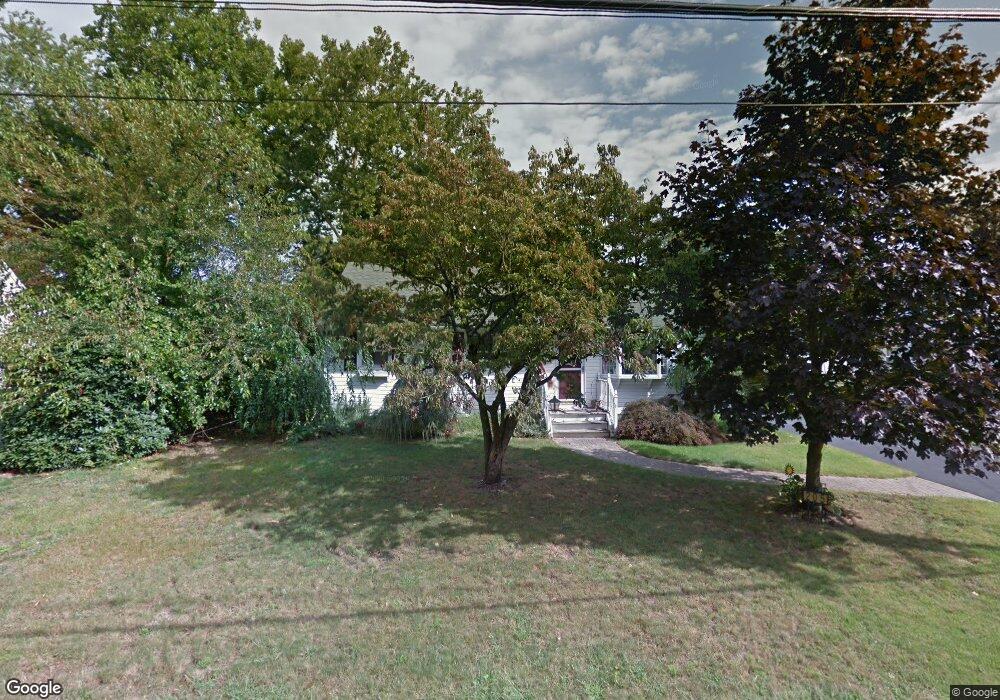
205 Willow Dr Neptune, NJ 07753
Estimated Value: $512,000 - $570,000
3
Beds
2
Baths
1,072
Sq Ft
$499/Sq Ft
Est. Value
About This Home
This home is located at 205 Willow Dr, Neptune, NJ 07753 and is currently estimated at $534,619, approximately $498 per square foot. 205 Willow Dr is a home located in Monmouth County with nearby schools including Neptune High School and Montessori Academy Of New Jersey.
Ownership History
Date
Name
Owned For
Owner Type
Purchase Details
Closed on
Jul 23, 2007
Sold by
Tranchina Christine
Bought by
Taylor Kathleen B
Current Estimated Value
Home Financials for this Owner
Home Financials are based on the most recent Mortgage that was taken out on this home.
Original Mortgage
$266,000
Outstanding Balance
$168,675
Interest Rate
6.78%
Mortgage Type
Purchase Money Mortgage
Estimated Equity
$365,944
Purchase Details
Closed on
Aug 31, 2005
Sold by
Karinja Matthew P
Bought by
Tranchina Christine
Home Financials for this Owner
Home Financials are based on the most recent Mortgage that was taken out on this home.
Original Mortgage
$280,000
Interest Rate
5.75%
Mortgage Type
Adjustable Rate Mortgage/ARM
Purchase Details
Closed on
May 15, 1998
Sold by
Wight James
Bought by
Karinja Matthew and Karinja Brenda
Home Financials for this Owner
Home Financials are based on the most recent Mortgage that was taken out on this home.
Original Mortgage
$123,000
Interest Rate
7.05%
Mortgage Type
FHA
Create a Home Valuation Report for This Property
The Home Valuation Report is an in-depth analysis detailing your home's value as well as a comparison with similar homes in the area
Home Values in the Area
Average Home Value in this Area
Purchase History
| Date | Buyer | Sale Price | Title Company |
|---|---|---|---|
| Taylor Kathleen B | $350,000 | Chicago Title Insurance Co | |
| Tranchina Christine | $350,000 | -- | |
| Karinja Matthew | $124,500 | -- |
Source: Public Records
Mortgage History
| Date | Status | Borrower | Loan Amount |
|---|---|---|---|
| Open | Taylor Kathleen B | $266,000 | |
| Previous Owner | Tranchina Christine | $280,000 | |
| Previous Owner | Karinja Matthew | $123,000 |
Source: Public Records
Tax History
| Year | Tax Paid | Tax Assessment Tax Assessment Total Assessment is a certain percentage of the fair market value that is determined by local assessors to be the total taxable value of land and additions on the property. | Land | Improvement |
|---|---|---|---|---|
| 2025 | $6,981 | $493,000 | $280,000 | $213,000 |
| 2024 | $6,680 | $398,700 | $221,000 | $177,700 |
| 2023 | $6,680 | $369,900 | $196,400 | $173,500 |
| 2022 | $5,933 | $329,200 | $168,800 | $160,400 |
| 2021 | $6,051 | $280,800 | $166,800 | $114,000 |
| 2020 | $6,117 | $288,800 | $180,800 | $108,000 |
| 2019 | $6,051 | $282,100 | $180,800 | $101,300 |
| 2018 | $5,774 | $266,100 | $147,500 | $118,600 |
| 2017 | $5,812 | $257,300 | $147,500 | $109,800 |
| 2016 | $5,887 | $259,900 | $152,500 | $107,400 |
| 2015 | $5,730 | $257,300 | $152,500 | $104,800 |
| 2014 | $5,857 | $216,200 | $122,500 | $93,700 |
Source: Public Records
Map
Nearby Homes
- 108 Elm Dr
- 7 Schoolhouse Rd
- 26 Pinebrook Dr
- 64 Wembley Way
- Crofton Plan at Jumping Brook - The Enclave
- Taylor Plan at Jumping Brook - The Enclave
- 65 Penny Ln
- 73 Penny Ln
- 67 Penny Ln
- 63 Penny Ln
- 69 Penny Ln
- 43 Victoria Gardens Square
- 31 Victoria Gardens Square
- 46 Victoria Gardens Square
- 42 Victoria Gardens Square
- 29 Victoria Gardens Square
- 35 Victoria Gardens Square
- 37 Victoria Gardens Square
- 39 Victoria Gardens Square
- 41 Victoria Gardens Square