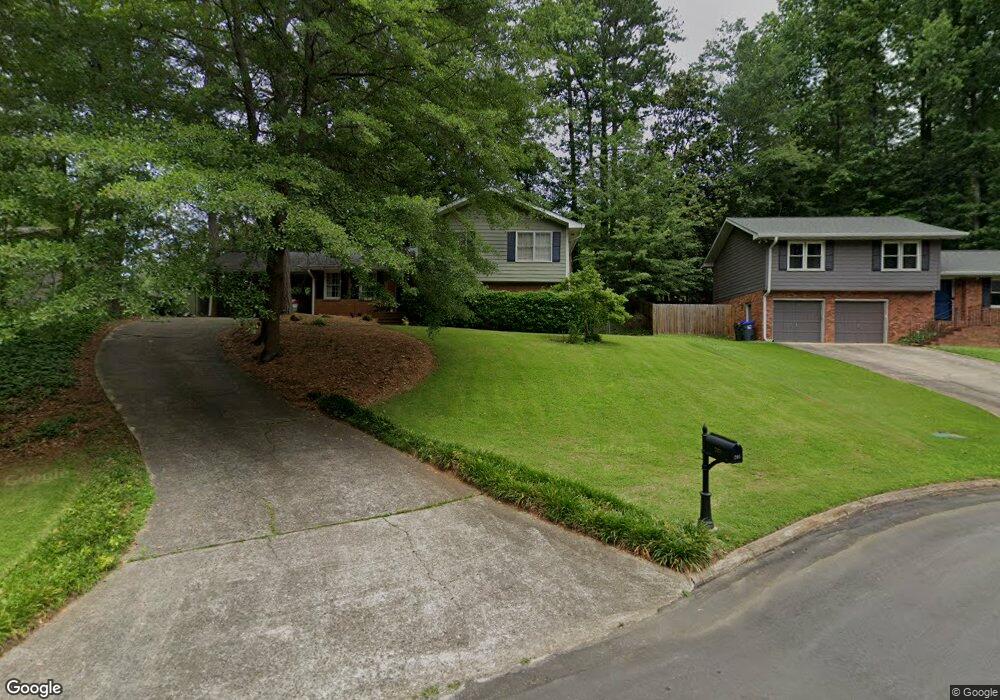
205 Windflower Trace Unit 2 Roswell, GA 30075
Estimated Value: $465,000 - $513,000
4
Beds
2
Baths
1,106
Sq Ft
$438/Sq Ft
Est. Value
About This Home
This home is located at 205 Windflower Trace Unit 2, Roswell, GA 30075 and is currently estimated at $483,904, approximately $437 per square foot. 205 Windflower Trace Unit 2 is a home located in Fulton County with nearby schools including Roswell North Elementary School, Crabapple Middle School, and Roswell High School.
Ownership History
Date
Name
Owned For
Owner Type
Purchase Details
Closed on
Jun 24, 2024
Sold by
Holroyd David
Bought by
Tsao Fay
Current Estimated Value
Home Financials for this Owner
Home Financials are based on the most recent Mortgage that was taken out on this home.
Original Mortgage
$280,000
Outstanding Balance
$276,372
Interest Rate
6.94%
Mortgage Type
New Conventional
Estimated Equity
$207,532
Purchase Details
Closed on
Nov 3, 2004
Sold by
Haddad Mazen M
Bought by
Thomason Lori S
Home Financials for this Owner
Home Financials are based on the most recent Mortgage that was taken out on this home.
Original Mortgage
$133,200
Interest Rate
5.77%
Mortgage Type
New Conventional
Purchase Details
Closed on
Nov 23, 1994
Sold by
Nisenoff Lawrence Lori A
Bought by
Haddad Mazen M
Home Financials for this Owner
Home Financials are based on the most recent Mortgage that was taken out on this home.
Original Mortgage
$85,500
Interest Rate
9.01%
Mortgage Type
FHA
Create a Home Valuation Report for This Property
The Home Valuation Report is an in-depth analysis detailing your home's value as well as a comparison with similar homes in the area
Home Values in the Area
Average Home Value in this Area
Purchase History
| Date | Buyer | Sale Price | Title Company |
|---|---|---|---|
| Tsao Fay | -- | -- | |
| Thomason Lori S | $166,500 | -- | |
| Haddad Mazen M | $13,300 | -- |
Source: Public Records
Mortgage History
| Date | Status | Borrower | Loan Amount |
|---|---|---|---|
| Open | Tsao Fay | $280,000 | |
| Previous Owner | Thomason Lori S | $133,200 | |
| Previous Owner | Haddad Mazen M | $85,500 |
Source: Public Records
Tax History Compared to Growth
Tax History
| Year | Tax Paid | Tax Assessment Tax Assessment Total Assessment is a certain percentage of the fair market value that is determined by local assessors to be the total taxable value of land and additions on the property. | Land | Improvement |
|---|---|---|---|---|
| 2025 | $482 | $128,600 | $34,080 | $94,520 |
| 2023 | $4,374 | $154,960 | $62,720 | $92,240 |
| 2022 | $1,807 | $136,120 | $52,280 | $83,840 |
| 2021 | $2,162 | $107,560 | $33,720 | $73,840 |
| 2020 | $2,188 | $97,720 | $21,680 | $76,040 |
| 2019 | $382 | $98,240 | $22,840 | $75,400 |
| 2018 | $2,118 | $95,880 | $22,280 | $73,600 |
| 2017 | $1,750 | $72,880 | $21,240 | $51,640 |
| 2016 | $1,724 | $72,360 | $21,240 | $51,120 |
| 2015 | $2,124 | $72,360 | $21,240 | $51,120 |
| 2014 | $1,682 | $67,640 | $19,840 | $47,800 |
Source: Public Records
Map
Nearby Homes
- 215 Windflower Trace
- 195 Windflower Trace
- 175 Moonshadow Ct
- 165 Moonshadow Ct
- 185 Moonshadow Ct Unit 1
- 185 Windflower Trace Unit 2
- 225 Windflower Trace
- 180 Windflower Trace Unit 2
- 155 Moonshadow Ct
- 200 Windflower Trace
- 195 Moonshadow Ct
- 170 Windflower Trace
- 235 Windflower Trace
- 235 Windflower Trace Unit A
- 210 Windflower Trace
- 205 Moonshadow Ct
- 500 Roswell Hills Place
- 170 Moonshadow Ct
- 510 Roswell Hills Place
- 160 Moonshadow Ct