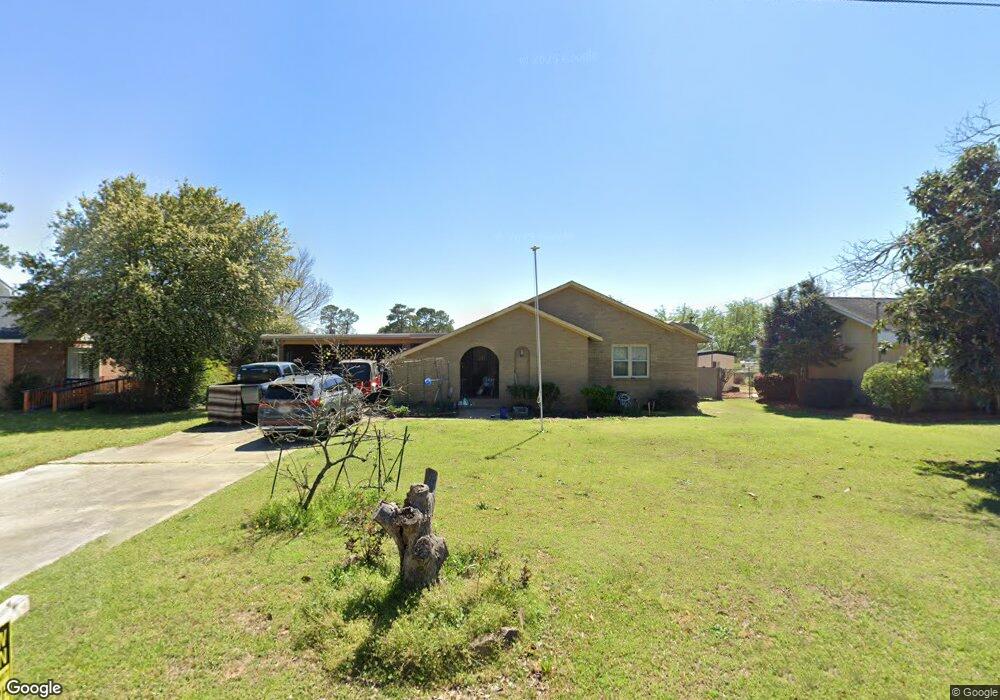
205 Wynn Place Warner Robins, GA 31088
Estimated Value: $151,377 - $190,000
3
Beds
2
Baths
1,531
Sq Ft
$115/Sq Ft
Est. Value
About This Home
This home is located at 205 Wynn Place, Warner Robins, GA 31088 and is currently estimated at $175,844, approximately $114 per square foot. 205 Wynn Place is a home located in Houston County with nearby schools including C. B. Watson Primary School, Pearl Stephens Elementary School, and Huntington Middle School.
Ownership History
Date
Name
Owned For
Owner Type
Purchase Details
Closed on
Jul 26, 2002
Sold by
The Aspen Company
Bought by
Holden Jeffrey R and Orapan C*
Current Estimated Value
Purchase Details
Closed on
May 30, 2002
Sold by
Schlageter Gary W and Schlageter Annetta C
Bought by
The Aspen Company
Purchase Details
Closed on
Aug 29, 1986
Sold by
Gentry Ronald E and Gentry Eleanor B
Bought by
Schlageter Gary W and Schlageter Annetta C
Purchase Details
Closed on
May 27, 1976
Sold by
Paramount Builders Inc
Bought by
Gentry Ronald E and Gentry Eleanor B
Purchase Details
Closed on
Mar 15, 1976
Sold by
Wood Oscar D
Bought by
Paramount Builders Inc
Purchase Details
Closed on
Aug 8, 1975
Sold by
Mcw Industries Inc
Bought by
Wood Oscar D
Purchase Details
Closed on
Oct 17, 1973
Sold by
Wynn Gordon F
Bought by
Mcw Industries Inc
Purchase Details
Closed on
Feb 10, 1971
Sold by
Wynn Joe A and Wynn Mary R
Bought by
Wynn Gordon F
Create a Home Valuation Report for This Property
The Home Valuation Report is an in-depth analysis detailing your home's value as well as a comparison with similar homes in the area
Home Values in the Area
Average Home Value in this Area
Purchase History
| Date | Buyer | Sale Price | Title Company |
|---|---|---|---|
| Holden Jeffrey R | $83,500 | -- | |
| The Aspen Company | $78,000 | -- | |
| Schlageter Gary W | -- | -- | |
| Gentry Ronald E | -- | -- | |
| Paramount Builders Inc | -- | -- | |
| Wood Oscar D | -- | -- | |
| Mcw Industries Inc | -- | -- | |
| Wynn Gordon F | -- | -- |
Source: Public Records
Tax History Compared to Growth
Tax History
| Year | Tax Paid | Tax Assessment Tax Assessment Total Assessment is a certain percentage of the fair market value that is determined by local assessors to be the total taxable value of land and additions on the property. | Land | Improvement |
|---|---|---|---|---|
| 2024 | $1,474 | $46,440 | $4,680 | $41,760 |
| 2023 | $1,232 | $38,760 | $4,680 | $34,080 |
| 2022 | $783 | $36,040 | $4,680 | $31,360 |
| 2021 | $701 | $32,320 | $4,680 | $27,640 |
| 2020 | $703 | $32,280 | $4,680 | $27,600 |
| 2019 | $703 | $32,280 | $4,680 | $27,600 |
| 2018 | $703 | $32,280 | $4,680 | $27,600 |
| 2017 | $704 | $32,280 | $4,680 | $27,600 |
| 2016 | $156 | $32,280 | $4,680 | $27,600 |
| 2015 | -- | $32,280 | $4,680 | $27,600 |
| 2014 | -- | $32,840 | $4,680 | $28,160 |
| 2013 | -- | $32,840 | $4,680 | $28,160 |
Source: Public Records
Map
Nearby Homes
- 103 W Point Ct
- 117 Maxwell Dr
- 105 Maxwell Dr
- 115 Virginia Dare Dr Unit MH
- 103 Virginia Dare Dr
- 203 Virginia Dare Dr
- 108 Virginia Dare Dr
- 129 Lincoln St
- 203 Jackson St
- 141 Wall St
- 314 Davids Place Dr
- 312 Davids Place Dr
- 310 Davids Place Dr
- 304 Wall St
- 330 Hidden Creek Cir
- 210 Scott Blvd
- 603 S Davis Dr
- 122 Driftwood Terrace
- 2679 Elko Rd
- 207 Wynn Place
- 203 Wynn Place
- 201 Wynn Place
- 200 Wynn Place
- 211 Wynn Place
- 208 Wynn Place
- 0 Wynn Place Unit 8037091
- 0 Wynn Place Unit 9020001
- 0 Wynn Place Unit 7316694
- 0 Wynn Place Unit 4851 Russell Pkwy
- 103 Audubon Way
- 215 Wynn Place
- 299 Wynn Place
- 216 Wynn Place
- 105 Audubon Way
- 104 Wynn Place
- 217 Wynn Place
- 105 Wynn Place
- 102 Audubon Way