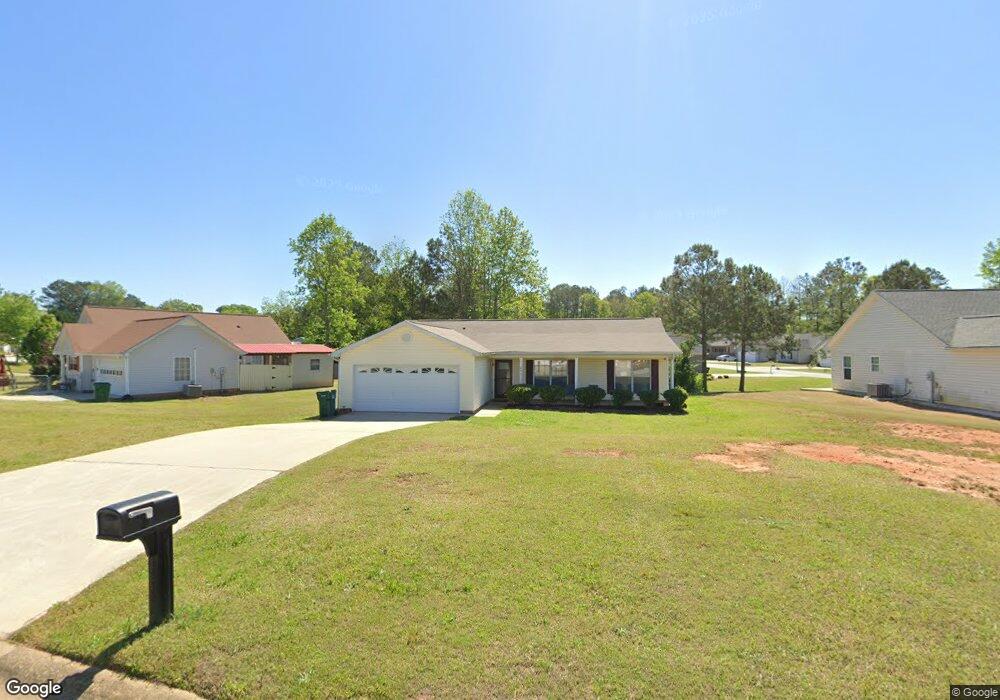
205 Yellowstone Dr Carrollton, GA 30117
Estimated Value: $248,887 - $266,000
3
Beds
2
Baths
1,500
Sq Ft
$170/Sq Ft
Est. Value
About This Home
This home is located at 205 Yellowstone Dr, Carrollton, GA 30117 and is currently estimated at $255,722, approximately $170 per square foot. 205 Yellowstone Dr is a home located in Carroll County with nearby schools including Carrollton Elementary School, Carrollton Upper Elementary School, and Carrollton Middle School.
Ownership History
Date
Name
Owned For
Owner Type
Purchase Details
Closed on
Jun 17, 2021
Sold by
Hill Kimberly S
Bought by
Farmer Jeri D
Current Estimated Value
Home Financials for this Owner
Home Financials are based on the most recent Mortgage that was taken out on this home.
Original Mortgage
$172,812
Outstanding Balance
$156,460
Interest Rate
2.9%
Mortgage Type
FHA
Estimated Equity
$99,262
Purchase Details
Closed on
Jul 15, 2005
Sold by
R & B Construction Inc
Bought by
Hill Kimberly S
Home Financials for this Owner
Home Financials are based on the most recent Mortgage that was taken out on this home.
Original Mortgage
$113,023
Interest Rate
5.59%
Mortgage Type
FHA
Purchase Details
Closed on
Apr 7, 2005
Sold by
Tna Properties Inc
Bought by
R & B Construction Inc
Purchase Details
Closed on
Nov 4, 2004
Sold by
Tna Properties Inc
Bought by
R & B Construction Inc
Purchase Details
Closed on
Jul 21, 2004
Bought by
Logon Development Inc
Create a Home Valuation Report for This Property
The Home Valuation Report is an in-depth analysis detailing your home's value as well as a comparison with similar homes in the area
Home Values in the Area
Average Home Value in this Area
Purchase History
| Date | Buyer | Sale Price | Title Company |
|---|---|---|---|
| Farmer Jeri D | $176,000 | -- | |
| Hill Kimberly S | $113,917 | -- | |
| R & B Construction Inc | $160,000 | -- | |
| R & B Construction Inc | $160,000 | -- | |
| Tna Properties Inc | $1,160,000 | -- | |
| Logon Development Inc | -- | -- |
Source: Public Records
Mortgage History
| Date | Status | Borrower | Loan Amount |
|---|---|---|---|
| Open | Farmer Jeri D | $172,812 | |
| Previous Owner | Hill Kimberly S | $113,023 |
Source: Public Records
Tax History Compared to Growth
Tax History
| Year | Tax Paid | Tax Assessment Tax Assessment Total Assessment is a certain percentage of the fair market value that is determined by local assessors to be the total taxable value of land and additions on the property. | Land | Improvement |
|---|---|---|---|---|
| 2024 | $2,528 | $92,514 | $6,000 | $86,514 |
| 2023 | $2,528 | $84,618 | $6,000 | $78,618 |
| 2022 | $2,016 | $69,073 | $6,000 | $63,073 |
| 2021 | $1,395 | $58,001 | $4,000 | $54,001 |
| 2020 | $1,252 | $51,716 | $4,000 | $47,716 |
| 2019 | $1,170 | $47,769 | $4,000 | $43,769 |
| 2018 | $1,033 | $41,396 | $4,000 | $37,396 |
| 2017 | $1,037 | $41,396 | $4,000 | $37,396 |
| 2016 | $1,003 | $39,662 | $2,266 | $37,396 |
| 2015 | $767 | $28,827 | $4,000 | $24,827 |
| 2014 | $770 | $28,827 | $4,000 | $24,827 |
Source: Public Records
Map
Nearby Homes
- 70 Henson Cir
- 0 Henson Cir Unit 10584639
- 0 Henson Cir Unit 7632920
- 114 Kyle Way
- 85 Mary Ln
- 219 Candlewood Dr
- 345 Henson Cir
- 0 Center Point Rd Unit TR 3 10274074
- 0 Center Point Rd Unit 7361099
- 70 W Meadowcliff Cir
- 125 Springwood Dr
- 300 Georgia 113
- 1015 Mote Rd
- 138 Zachary Dr
- 110 Sharp Dr
- 45 Buell Jones Rd
- 281 Northwinds Blvd
- 281 Northwinds Blvd Unit B3
- 281 Northwinds Blvd Unit D3
- 524 Old Bremen Rd
- 201 Yellowstone Dr
- 209 Yellowstone Dr
- 200 Glacier Ct Unit 10
- 0 Glacier Ct Unit 8863330
- 0 Glacier Ct Unit 8997634
- 0 Glacier Ct Unit 9035521
- 115 Yellowstone Dr Unit 6
- 115 Yellowstone Dr
- 202 Yellowstone Dr
- 204 Yellowstone Dr
- 208 Yellowstone Dr
- 206 Yellowstone Dr
- 202 Glacier Ct
- 204 Glacier Ct
- 111 Yellowstone Dr
- 116 Yellowstone Dr
- 104 Teton Ave Unit 72
- 104 Teton Ave
- 101 Teton Ave
- 203 Glacier Ct