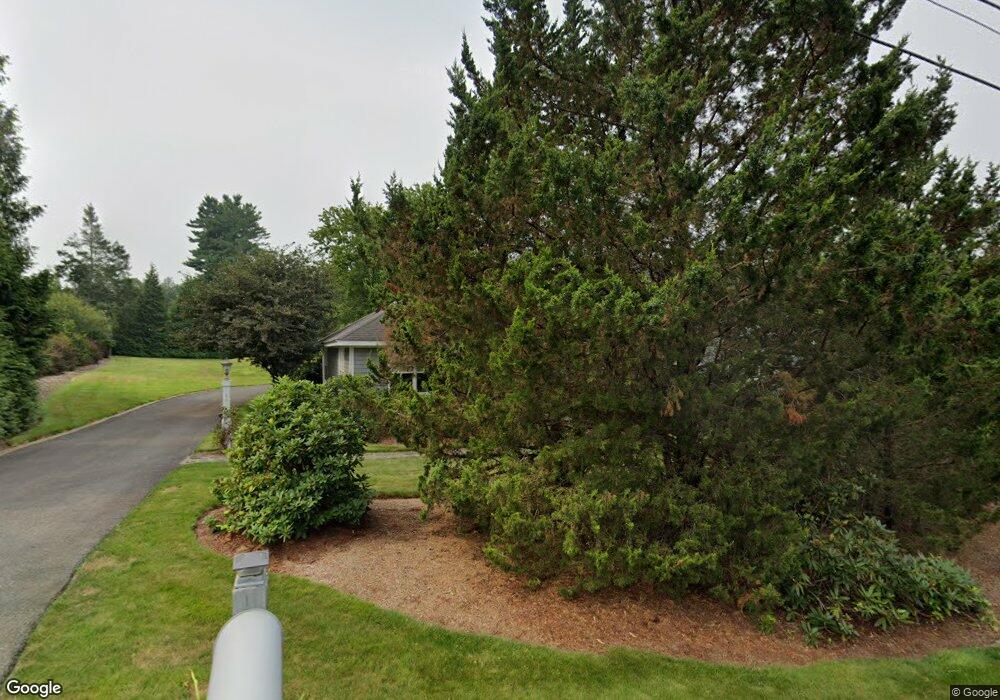
2050 Allen St Springfield, MA 01118
Sixteen Acres NeighborhoodEstimated Value: $309,000 - $377,000
4
Beds
2
Baths
1,636
Sq Ft
$212/Sq Ft
Est. Value
About This Home
This home is located at 2050 Allen St, Springfield, MA 01118 and is currently estimated at $347,620, approximately $212 per square foot. 2050 Allen St is a home located in Hampden County with nearby schools including Daniel B Brunton, M Marcus Kiley Middle, and Springfield High School of Science and Technology.
Ownership History
Date
Name
Owned For
Owner Type
Purchase Details
Closed on
Sep 11, 2024
Sold by
Paquette Paul A and Ketchen Lorraine E
Bought by
Ketchen Gregory P and Paquette Nicholas S
Current Estimated Value
Purchase Details
Closed on
Aug 25, 2004
Sold by
Ketchen Lorraine A and Ketchen Lorraine E
Bought by
Ketchen Gregory P and Leblanc Karen E
Purchase Details
Closed on
Aug 29, 2001
Sold by
Rackliffe Thelma S
Bought by
Ketchen Lorraine E
Home Financials for this Owner
Home Financials are based on the most recent Mortgage that was taken out on this home.
Original Mortgage
$74,850
Interest Rate
7.06%
Mortgage Type
Purchase Money Mortgage
Create a Home Valuation Report for This Property
The Home Valuation Report is an in-depth analysis detailing your home's value as well as a comparison with similar homes in the area
Home Values in the Area
Average Home Value in this Area
Purchase History
| Date | Buyer | Sale Price | Title Company |
|---|---|---|---|
| Ketchen Gregory P | -- | None Available | |
| Ketchen Gregory P | -- | None Available | |
| Ketchen Gregory P | -- | -- | |
| Ketchen Lorraine E | $93,600 | -- | |
| Ketchen Gregory P | -- | -- | |
| Ketchen Lorraine E | $93,600 | -- |
Source: Public Records
Mortgage History
| Date | Status | Borrower | Loan Amount |
|---|---|---|---|
| Previous Owner | Ketchen Lorraine E | $74,850 |
Source: Public Records
Tax History Compared to Growth
Tax History
| Year | Tax Paid | Tax Assessment Tax Assessment Total Assessment is a certain percentage of the fair market value that is determined by local assessors to be the total taxable value of land and additions on the property. | Land | Improvement |
|---|---|---|---|---|
| 2025 | $4,941 | $315,100 | $59,300 | $255,800 |
| 2024 | $4,805 | $299,200 | $59,300 | $239,900 |
| 2023 | $4,343 | $254,700 | $56,400 | $198,300 |
| 2022 | $4,289 | $227,900 | $56,400 | $171,500 |
| 2021 | $4,071 | $215,400 | $51,300 | $164,100 |
| 2020 | $4,334 | $221,900 | $51,300 | $170,600 |
| 2019 | $3,926 | $199,500 | $51,300 | $148,200 |
| 2018 | $4,003 | $203,400 | $51,300 | $152,100 |
| 2017 | $3,903 | $198,500 | $51,300 | $147,200 |
| 2016 | $3,649 | $185,600 | $51,300 | $134,300 |
| 2015 | $3,623 | $184,200 | $51,300 | $132,900 |
Source: Public Records
Map
Nearby Homes
- 0 Apple Blossom Ln
- 55 Allen St
- 17 Skyridge Ln
- 111 Malibu Dr
- 15 Lynwood Rd
- 25 Laurelwood Ln
- 78 Meadow Rd
- 41 Hillside Dr
- 65 Fair Oak Rd
- 98 Brookhaven Dr
- 82 Louis Rd
- 85 Talmadge Dr
- 86 Talmadge Dr
- 72 Tanglewood Dr
- 42 Talmadge Dr
- 865 S Branch Pkwy
- 123 Mountainview Rd
- 46 Holland Dr
- 31 Acrebrook Rd
- 17 Pebble Mill Rd