NOT LISTED FOR SALE

2050 Crestview Dr Valparaiso, IN 46383

Estimated Value: $405,927 - $485,000

4 Beds
3 Baths
3,015 Sq Ft
$144/Sq Ft Est. Value

Last Sold July 10, 2015

Last sale price $233,000 $77 Per Sq Ft

Est. 86% increase in value since last sale

Current estimated payment $2,544/month

About This Home

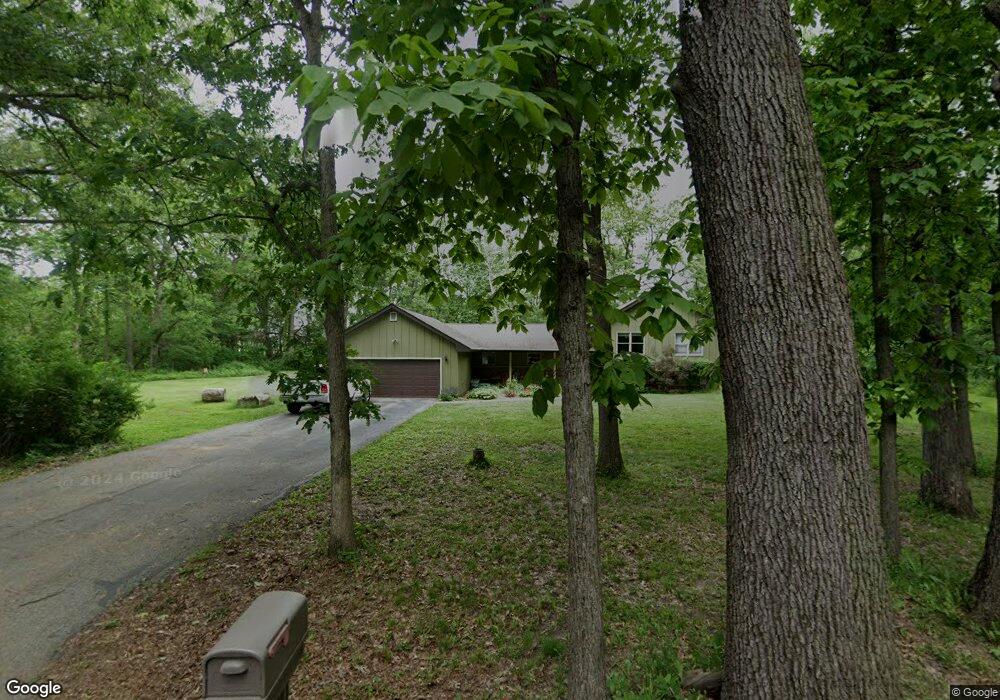
What a wonderful sanctuary! Spacious Tri Level at the end of the street. Nature surrounds this well kept beauty. 4 large bedrooms, family room, spacious living room with large windows, totally updated kitchen with stunning cabinetry and stainless steel appliances. All 3 bathrooms updated as well. More storage than one could use all on over an acre. Wooded and ready for your family

Ownership History

Date Name Owned For Owner Type

Purchase Details

Listed on
Mar 12, 2015
Closed on
Jun 29, 2015
Sold by
Mellul Malania Ann and The Malania Ann Mellul Revocab
Bought by
Zlamal Jason and Zlamal Rachael
Seller's Agent
Geri Melton Rose
Century 21 Affiliated
List Price
$233,000
Sold Price
$233,000
Current Estimated Value
$433,732

Home Financials for this Owner

Home Financials are based on the most recent Mortgage that was taken out on this home.
Estimated Appreciation
$200,732
Avg. Annual Appreciation
6.21%
Original Mortgage
$228,779
Outstanding Balance
$178,451
Interest Rate
3.87%
Mortgage Type
FHA
Estimated Equity
$255,281
Source: Public Records

Range of Values:

Collateral Analytics

Collateral Analytics Collateral Analytics AVMs (Automated Valuation Model) employ a number of statistical approaches combined with neighborhood-specific comparable selection guarantees the most up-to-date and precise valuations.

Not Available

Collateral Analytics does not have data for the current month. Please view the chart for historical values.

ICE

ICE Mortgage Technology ICE Mortgage Technology’s AVM (Automated Valuation Model) is a state-of-the-art online residential property valuation tool that provides a quick and accurate estimate of the value of almost any home in the U.S.

Not Available

ICE Mortgage Technology does not have data for the current month. Please view the chart for historical values.

First American

First American First American Data & Analytics’ next-generation AVM combines unrivaled data assets with a blended ensemble of valuation models to produce highly accurate, reliable valuations you can trust.

Not Available

First American does not have data for the current month. Please view the chart for historical values.

Quantarium

Quantarium Quantarium’s valuation service, repeatedly proven the industry’s most accurate and comprehensive, is supercharged with a self-learning and auto-tuning AI engine that continually becomes smarter and more accurate as it processes daily inputs from the industry’s leading RE data lake.

Not Available

Quantarium does not have data for the current month. Please view the chart for historical values.

Average Value
Not Available
List Price
Sold Price
Create a Home Valuation Report for This Property
The Home Valuation Report is an in-depth analysis detailing your home's value as well as a comparison with similar homes in the area

Home Values in the Area

Source: Public Records

Average Home Value in this Area


Source: Public Records

Purchase History

Date Buyer Sale Price Title Company
Zlamal Jason -- Prism Title
Source: Public Records

Mortgage History

Date Status Borrower Loan Amount
Open Zlamal Jason $228,779
Source: Public Records

Property History

Date Event Price List to Sale Price per Sq Ft Prior Sale
07/10/2015 07/10/15 Sold $233,000 0.0% $77 / Sq Ft View Prior Sale
06/15/2015 06/15/15 Pending -- -- --
03/12/2015 03/12/15 For Sale $233,000 -- $77 / Sq Ft

Tax History Compared to Growth

Source: Public Records

Tax History

Year Tax Paid Tax Assessment Tax Assessment Total Assessment is a certain percentage of the fair market value that is determined by local assessors to be the total taxable value of land and additions on the property. Land Improvement
2024 $3,138 $366,600 $55,100 $311,500
2023 $3,092 $365,300 $51,500 $313,800
2022 $2,952 $328,400 $51,500 $276,900
2021 $2,928 $286,000 $51,500 $234,500
2020 $2,825 $270,000 $44,800 $225,200
2019 $2,598 $244,700 $44,800 $199,900
2018 $2,687 $250,800 $44,800 $206,000
2017 $2,585 $247,600 $44,800 $202,800
2016 $2,969 $283,500 $61,600 $221,900
2014 $2,460 $281,500 $61,200 $220,300
2013 -- $269,500 $61,200 $208,300
Source: Public Records

Agents Affiliated with this Home

  • Section Image
See All Agents

Map