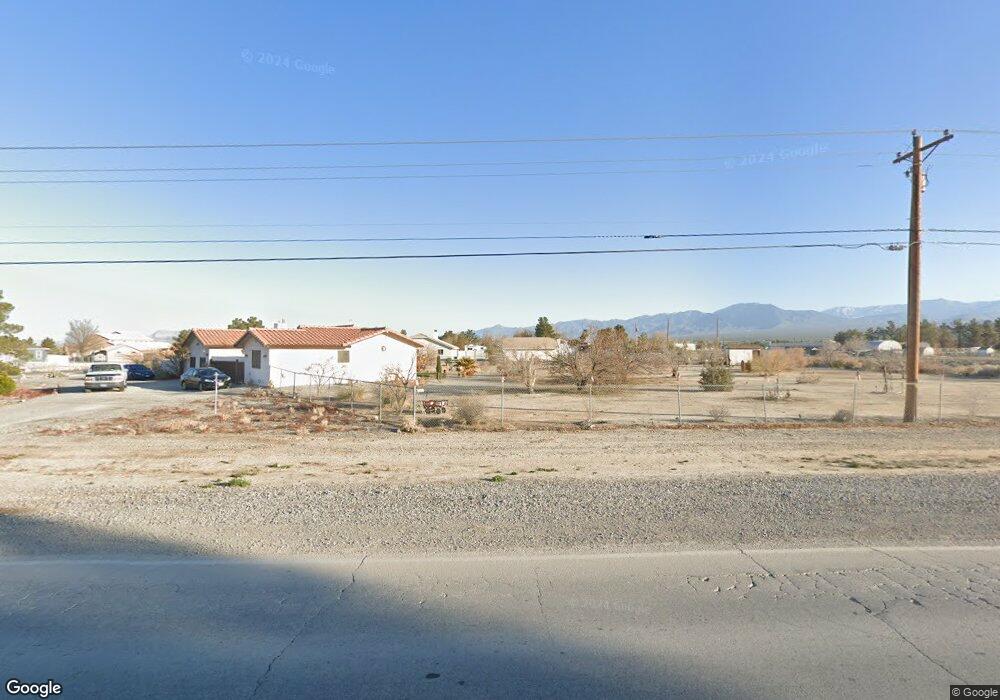
2050 E Gamebird Rd Pahrump, NV 89048
Estimated Value: $173,000 - $362,000
--
Bed
--
Bath
1,959
Sq Ft
$145/Sq Ft
Est. Value
About This Home
This home is located at 2050 E Gamebird Rd, Pahrump, NV 89048 and is currently estimated at $284,126, approximately $145 per square foot. 2050 E Gamebird Rd is a home located in Nye County with nearby schools including Floyd Elementary School, Rosemary Clarke Middle School, and Pahrump Valley High School.
Ownership History
Date
Name
Owned For
Owner Type
Purchase Details
Closed on
Mar 24, 2010
Sold by
Santaniello Laura A
Bought by
Santaniello Steven J and Santaniello Laura A
Current Estimated Value
Purchase Details
Closed on
Jun 29, 2009
Sold by
Santaniello Steven J
Bought by
Santaniello Laura
Purchase Details
Closed on
Jun 26, 2009
Sold by
Deutsche Bank National Trust Company
Bought by
Santaniello Laura
Purchase Details
Closed on
May 27, 2009
Sold by
Bennett Terry Lee and Bennett Darlene
Bought by
Deutsche Bank National Trust Company
Purchase Details
Closed on
Jan 13, 2005
Sold by
Bennett Terry Lee
Bought by
Bennett Terry Lee and Bennett Darlene
Home Financials for this Owner
Home Financials are based on the most recent Mortgage that was taken out on this home.
Original Mortgage
$140,000
Interest Rate
5.69%
Mortgage Type
New Conventional
Create a Home Valuation Report for This Property
The Home Valuation Report is an in-depth analysis detailing your home's value as well as a comparison with similar homes in the area
Home Values in the Area
Average Home Value in this Area
Purchase History
| Date | Buyer | Sale Price | Title Company |
|---|---|---|---|
| Santaniello Steven J | -- | None Available | |
| Santaniello Laura | -- | Chicago Title Las Vegas | |
| Santaniello Laura | $67,000 | Chicago Title Las Vegas | |
| Deutsche Bank National Trust Company | $120,393 | Accommodation | |
| Bennett Terry Lee | -- | Lawyes Title Of Nv |
Source: Public Records
Mortgage History
| Date | Status | Borrower | Loan Amount |
|---|---|---|---|
| Previous Owner | Bennett Terry Lee | $140,000 |
Source: Public Records
Tax History Compared to Growth
Tax History
| Year | Tax Paid | Tax Assessment Tax Assessment Total Assessment is a certain percentage of the fair market value that is determined by local assessors to be the total taxable value of land and additions on the property. | Land | Improvement |
|---|---|---|---|---|
| 2025 | $1,225 | $50,138 | $4,549 | $45,589 |
| 2024 | $1,225 | $50,555 | $4,549 | $46,006 |
| 2023 | $1,225 | $47,631 | $4,549 | $43,082 |
| 2022 | $1,154 | $43,822 | $4,549 | $39,273 |
| 2021 | $1,124 | $41,880 | $3,639 | $38,241 |
| 2020 | $1,061 | $41,106 | $3,639 | $37,467 |
| 2019 | $1,030 | $49,214 | $3,639 | $45,575 |
| 2018 | $1,001 | $46,977 | $2,911 | $44,066 |
| 2017 | $973 | $37,999 | $2,911 | $35,088 |
| 2016 | $950 | $27,620 | $2,911 | $24,709 |
| 2015 | $948 | $25,678 | $2,911 | $22,767 |
| 2014 | $921 | $27,631 | $2,911 | $24,720 |
Source: Public Records
Map
Nearby Homes
- 4090 Jackie St
- 3721 Twilight Ave
- 2330 E Gamebird Rd
- 1640 Bruce St
- 3750 Ranger Way
- 1820 E Pluto St
- 3581 Margarita Ave
- 3901 S Money St
- 1891 Pioche St
- 3471 Unicorn Ave
- 3720 S Ranger Way
- 4400 Vicki Ann Rd
- 1391 E Gamebird Rd
- 3750 Unicorn Ave
- 1611 Pluto St
- 1550 Jeane Ave
- 3521 Money St
- 1741 E Deerskin St
- 3401 E Elderberry St
- 1291 E Pioche St
- 3941 Unicorn Ave
- 1921 E Gamebird Rd
- 1861 E Gamebird Rd
- 1891 E Gamebird Rd
- 3980 Unicorn Ave
- 1951 E Gamebird Rd
- 2120 E Gamebird Rd
- 3950 Unicorn Ave
- 3901 Unicorn Ave
- 3920 Unicorn Ave
- 2091 E Falcon St
- 2121 E Falcon St
- 2150 Gamebird Rd
- 3890 Unicorn Ave
- 1821 E Gamebird Rd
- 1920 E Gamebird Rd
- 1920 Pioche St
- 1860 Pioche St
- 3861 Unicorn Ave
- 1950 Pioche St