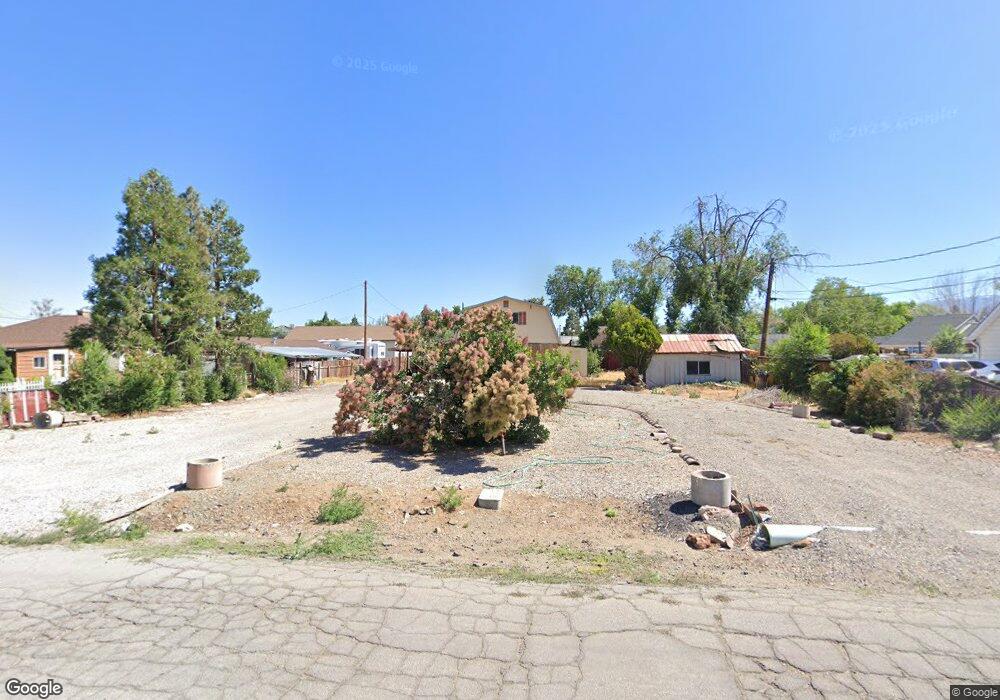
2050 Fife Dr Reno, NV 89512
Northeast Reno NeighborhoodEstimated Value: $376,000 - $388,396
3
Beds
2
Baths
1,386
Sq Ft
$275/Sq Ft
Est. Value
About This Home
This home is located at 2050 Fife Dr, Reno, NV 89512 and is currently estimated at $380,799, approximately $274 per square foot. 2050 Fife Dr is a home located in Washoe County with nearby schools including Rita Cannan Elementary School, Fred W. Traner Middle School, and Procter R. Hug High School.
Ownership History
Date
Name
Owned For
Owner Type
Purchase Details
Closed on
Dec 7, 2009
Sold by
Federal Home Loan Mortgage Corporation
Bought by
Curran Mike
Current Estimated Value
Home Financials for this Owner
Home Financials are based on the most recent Mortgage that was taken out on this home.
Original Mortgage
$50,000
Outstanding Balance
$32,411
Interest Rate
4.78%
Mortgage Type
Purchase Money Mortgage
Estimated Equity
$348,388
Purchase Details
Closed on
Sep 8, 2009
Sold by
Robards Clyde N
Bought by
Federal Home Loan Mortgage Corporation
Purchase Details
Closed on
Nov 10, 1997
Sold by
Robards Dana Lee and Robards Ronald Roy
Bought by
Robards Clyde N
Home Financials for this Owner
Home Financials are based on the most recent Mortgage that was taken out on this home.
Original Mortgage
$70,000
Interest Rate
9.5%
Create a Home Valuation Report for This Property
The Home Valuation Report is an in-depth analysis detailing your home's value as well as a comparison with similar homes in the area
Home Values in the Area
Average Home Value in this Area
Purchase History
| Date | Buyer | Sale Price | Title Company |
|---|---|---|---|
| Curran Mike | $64,500 | First Amer Title Paseo Verde | |
| Federal Home Loan Mortgage Corporation | $78,840 | First American Title Ins Co | |
| Robards Clyde N | $85,500 | Founders Title Co |
Source: Public Records
Mortgage History
| Date | Status | Borrower | Loan Amount |
|---|---|---|---|
| Open | Curran Mike | $50,000 | |
| Previous Owner | Robards Clyde N | $70,000 |
Source: Public Records
Tax History Compared to Growth
Tax History
| Year | Tax Paid | Tax Assessment Tax Assessment Total Assessment is a certain percentage of the fair market value that is determined by local assessors to be the total taxable value of land and additions on the property. | Land | Improvement |
|---|---|---|---|---|
| 2025 | $783 | $51,217 | $30,065 | $21,152 |
| 2024 | $646 | $51,007 | $30,065 | $20,942 |
| 2023 | $533 | $50,217 | $30,975 | $19,242 |
| 2022 | $613 | $46,290 | $30,975 | $15,315 |
| 2021 | $543 | $37,719 | $22,750 | $14,969 |
| 2020 | $502 | $35,743 | $21,000 | $14,743 |
| 2019 | $634 | $35,081 | $21,000 | $14,081 |
| 2018 | $615 | $32,761 | $19,250 | $13,511 |
| 2017 | $597 | $24,518 | $11,165 | $13,353 |
| 2016 | $547 | $22,322 | $9,975 | $12,347 |
| 2015 | $546 | $19,024 | $6,860 | $12,164 |
| 2014 | $505 | $14,589 | $3,885 | $10,704 |
| 2013 | -- | $14,345 | $3,990 | $10,355 |
Source: Public Records
Map
Nearby Homes
- 1855 Mccloud Ave
- 1868 Fife Dr
- 1990 Trainer Way
- 2301 Oddie Blvd Unit 47
- 2301 Oddie Blvd Unit 56
- 2301 Oddie Blvd Unit 162
- 2301 Oddie Blvd Unit 124
- 1885 Castle Way
- 2065 Wedekind Rd
- 1925 Citron St
- 2090 Highview Ct Unit 7
- 1347 Butler St
- 1955 Wilder St
- 2101 Highview Ct Unit 9
- 2085 Highview Ct Unit 2
- 1895 Citron St
- 2500 Tripp Dr Unit 4
- 2355 Tripp Dr Unit 7
- 204 Poppy Ln
- 112 Lilac Ln
- 2070 Fife Dr
- 1870 Mccloud Ave
- 1860 Mccloud Ave
- 1890 Mccloud Ave
- 1985 Clear Acre Ln
- 2055 Fife Dr
- 2075 Fife Dr
- 1850 Mccloud Ave
- 2015 Fife Dr
- 2005 Clear Acre Ln
- 1835 Clear Acre Ln
- 1865 Mccloud Ave
- 1875 Mccloud Ave
- 1840 Mccloud Ave
- 2005 Fife Dr
- 1885 Mccloud Ave
- 1859 Mccloud Ave
- 1895 Mccloud Ave
- 2180 Citron St
- 2160 Citron St