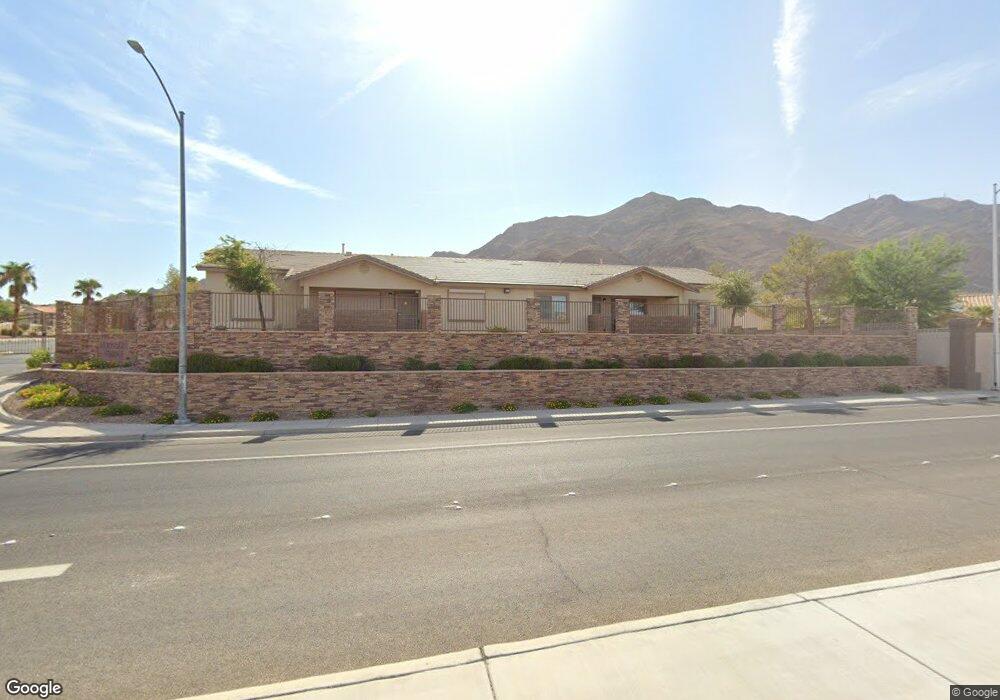
2050 Los Feliz St Unit 143 Las Vegas, NV 89156
Estimated Value: $245,000 - $299,780
3
Beds
3
Baths
1,626
Sq Ft
$173/Sq Ft
Est. Value
About This Home
This home is located at 2050 Los Feliz St Unit 143, Las Vegas, NV 89156 and is currently estimated at $281,945, approximately $173 per square foot. 2050 Los Feliz St Unit 143 is a home located in Clark County with nearby schools including Mountain View Elementary School, Dr. William H. Bailey Middle School, and Sunrise Mountain High School.
Ownership History
Date
Name
Owned For
Owner Type
Purchase Details
Closed on
Sep 24, 2010
Sold by
Fannie Mae
Bought by
Romberg David
Current Estimated Value
Purchase Details
Closed on
Jun 30, 2010
Sold by
Straw David L
Bought by
Federal National Mortgage Association
Purchase Details
Closed on
Sep 16, 2004
Sold by
Sunrise Mountain Associates Llc
Bought by
Straw David L
Home Financials for this Owner
Home Financials are based on the most recent Mortgage that was taken out on this home.
Original Mortgage
$206,400
Interest Rate
5.93%
Mortgage Type
Fannie Mae Freddie Mac
Purchase Details
Closed on
Mar 17, 2004
Sold by
Sunrise Mountain Associates Llc
Bought by
Nolte Kathleen L
Home Financials for this Owner
Home Financials are based on the most recent Mortgage that was taken out on this home.
Original Mortgage
$111,750
Interest Rate
5.64%
Mortgage Type
Unknown
Create a Home Valuation Report for This Property
The Home Valuation Report is an in-depth analysis detailing your home's value as well as a comparison with similar homes in the area
Home Values in the Area
Average Home Value in this Area
Purchase History
| Date | Buyer | Sale Price | Title Company |
|---|---|---|---|
| Romberg David | $67,000 | Stewart Title Las Vegas War | |
| Federal National Mortgage Association | $48,000 | First American National Defa | |
| Straw David L | $244,950 | Fidelity National Title | |
| Nolte Kathleen L | $124,200 | Old Republic Title Co Of Ne |
Source: Public Records
Mortgage History
| Date | Status | Borrower | Loan Amount |
|---|---|---|---|
| Previous Owner | Straw David L | $206,400 | |
| Previous Owner | Nolte Kathleen L | $111,750 |
Source: Public Records
Tax History Compared to Growth
Tax History
| Year | Tax Paid | Tax Assessment Tax Assessment Total Assessment is a certain percentage of the fair market value that is determined by local assessors to be the total taxable value of land and additions on the property. | Land | Improvement |
|---|---|---|---|---|
| 2025 | $1,135 | $87,027 | $22,050 | $64,977 |
| 2024 | $1,051 | $87,027 | $22,050 | $64,977 |
| 2023 | $1,051 | $87,714 | $28,700 | $59,014 |
| 2022 | $974 | $80,057 | $24,150 | $55,907 |
| 2021 | $902 | $65,794 | $20,300 | $45,494 |
| 2020 | $834 | $64,739 | $19,250 | $45,489 |
| 2019 | $782 | $60,936 | $14,000 | $46,936 |
| 2018 | $746 | $49,026 | $9,100 | $39,926 |
| 2017 | $1,272 | $43,382 | $6,650 | $36,732 |
| 2016 | $700 | $33,836 | $6,300 | $27,536 |
| 2015 | $697 | $26,274 | $4,550 | $21,724 |
| 2014 | $677 | $22,407 | $3,500 | $18,907 |
Source: Public Records
Map
Nearby Homes
- 7198 Pascal Dr
- 2110 Los Feliz St Unit 2037
- 2110 Los Feliz St Unit 2069
- 2110 Los Feliz St Unit 2091
- 2110 Los Feliz St Unit 1096
- 2110 Los Feliz St Unit 1034
- 2110 Los Feliz St Unit 1066
- 2110 Los Feliz St Unit 2064
- 2236 Welsey Manor Dr
- 1888 Claudine Dr
- 1880 Claudine Dr
- 1860 Racine Dr
- 1864 Claudine Dr
- 7055 Canary Ivy Way
- 7090 Burcot Ave Unit B32
- 7040 Canary Ivy Way
- 7054 Burcot Ave Unit 40
- 2170 Dragon Claw Ln
- 2281 Los Feliz St
- 7253 Alsop Ct
- 2050 Los Feliz St
- 2050 Los Feliz St Unit 168
- 2050 Los Feliz St Unit 183
- 2050 Los Feliz St Unit 109
- 2050 Los Feliz St Unit 151
- 2050 Los Feliz St Unit 131
- 2050 Los Feliz St Unit 128
- 2050 Los Feliz St Unit 124
- 2050 Los Feliz St Unit 125
- 2050 Los Feliz St Unit 122
- 2050 Los Feliz St Unit 149
- 2050 Los Feliz St Unit 145
- 2050 Los Feliz St Unit 144
- 2050 Los Feliz St Unit 148
- 2050 Los Feliz St Unit 141
- 2050 Los Feliz St Unit 137
- 2050 Los Feliz St Unit 134
- 2050 Los Feliz St Unit 103
- 2050 Los Feliz St Unit 111
- 2050 Los Feliz St Unit 113