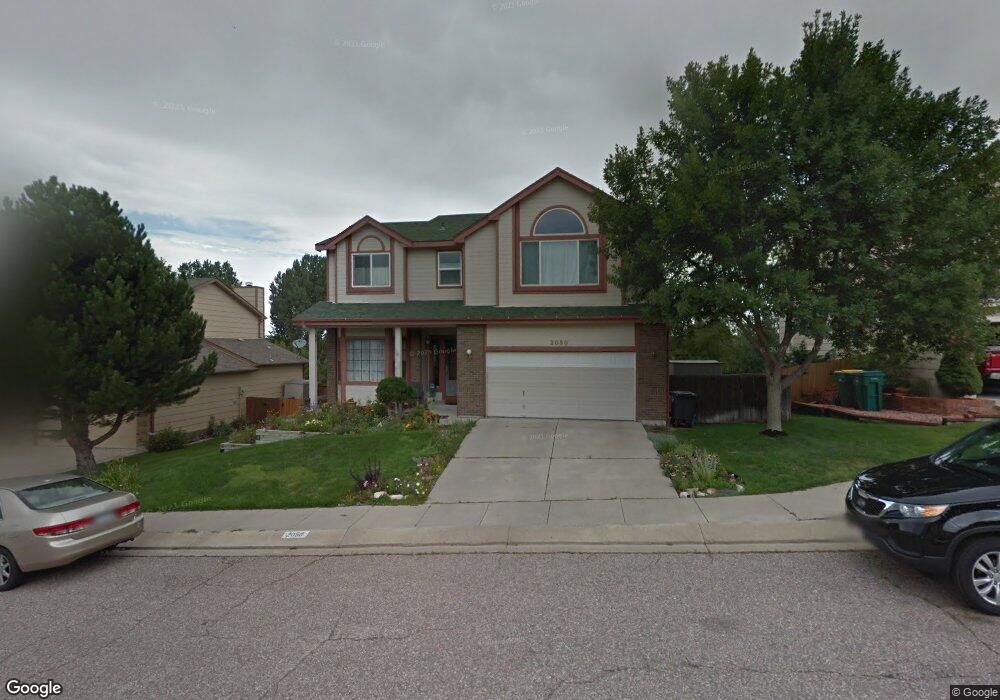
2050 Springcrest Rd Colorado Springs, CO 80920
Pine Creek NeighborhoodEstimated Value: $539,455 - $601,000
4
Beds
4
Baths
2,002
Sq Ft
$290/Sq Ft
Est. Value
About This Home
This home is located at 2050 Springcrest Rd, Colorado Springs, CO 80920 and is currently estimated at $581,364, approximately $290 per square foot. 2050 Springcrest Rd is a home located in El Paso County with nearby schools including Mountain View Elementary School, Challenger Middle School, and Pine Creek High School.
Ownership History
Date
Name
Owned For
Owner Type
Purchase Details
Closed on
Jan 18, 2001
Sold by
Purswell Valerie E and Purswell Jerry P
Bought by
Purswell Jerry P and Purswell Valerie E
Current Estimated Value
Home Financials for this Owner
Home Financials are based on the most recent Mortgage that was taken out on this home.
Original Mortgage
$160,000
Outstanding Balance
$57,534
Interest Rate
7.19%
Estimated Equity
$523,830
Purchase Details
Closed on
Aug 11, 1998
Sold by
Yale Craig M and Yale Vickie D
Bought by
Purswell Valerie E and Pruswell Jerry P
Purchase Details
Closed on
May 22, 1992
Bought by
Purswell Valerie E and Purswell Jerry P
Purchase Details
Closed on
Mar 4, 1992
Bought by
Purswell Valerie E and Purswell Jerry P
Purchase Details
Closed on
Feb 13, 1992
Bought by
Purswell Valerie E and Purswell Jerry P
Purchase Details
Closed on
Jan 16, 1992
Bought by
Purswell Valerie E and Purswell Jerry P
Create a Home Valuation Report for This Property
The Home Valuation Report is an in-depth analysis detailing your home's value as well as a comparison with similar homes in the area
Home Values in the Area
Average Home Value in this Area
Purchase History
| Date | Buyer | Sale Price | Title Company |
|---|---|---|---|
| Purswell Jerry P | -- | Nations Title Agency Inc | |
| Purswell Valerie E | $215,000 | First American | |
| Purswell Valerie E | $138,400 | -- | |
| Purswell Valerie E | -- | -- | |
| Purswell Valerie E | -- | -- | |
| Purswell Valerie E | $24,000 | -- | |
| Purswell Valerie E | -- | -- |
Source: Public Records
Mortgage History
| Date | Status | Borrower | Loan Amount |
|---|---|---|---|
| Open | Purswell Jerry P | $160,000 |
Source: Public Records
Tax History Compared to Growth
Tax History
| Year | Tax Paid | Tax Assessment Tax Assessment Total Assessment is a certain percentage of the fair market value that is determined by local assessors to be the total taxable value of land and additions on the property. | Land | Improvement |
|---|---|---|---|---|
| 2025 | $2,115 | $38,740 | -- | -- |
| 2024 | $2,082 | $39,100 | $5,360 | $33,740 |
| 2022 | $1,892 | $28,600 | $5,350 | $23,250 |
| 2021 | $2,103 | $29,430 | $5,510 | $23,920 |
| 2020 | $2,124 | $27,590 | $4,400 | $23,190 |
| 2019 | $2,101 | $27,590 | $4,400 | $23,190 |
| 2018 | $1,747 | $22,540 | $4,030 | $18,510 |
| 2017 | $1,740 | $22,540 | $4,030 | $18,510 |
| 2016 | $1,696 | $21,940 | $4,150 | $17,790 |
| 2015 | $1,693 | $21,940 | $4,150 | $17,790 |
| 2014 | $1,599 | $20,700 | $4,150 | $16,550 |
Source: Public Records
Map
Nearby Homes
- 2035 Springcrest Rd
- 2135 Springcrest Rd
- 2070 Alamosa Dr
- 2360 Pine Valley View
- 2479 Pine Valley View
- 1225 Montezuma Rd
- 2512 Willow Glen Dr
- 2457 Craycroft Dr
- 2631 Emerald Ridge Dr
- 2032 Peridot Loop Heights
- 2240 Peridot Loop Heights
- 10645 Helenite Point
- 10544 Helenite Point
- 10554 Helenite Point
- 2712 Emerald Ridge Dr
- 10546 Domeykite View
- 1996 Peridot Loop Heights
- 2130 Wimbleton Ct
- Brendon Plan at Victory Ridge - Parkside
- Kendrick Plan at Victory Ridge - The Commons
- 2060 Springcrest Rd
- 2040 Springcrest Rd
- 2030 Springcrest Rd
- 2055 Springcrest Rd
- 2045 Springcrest Rd
- 2065 Springcrest Rd
- 1915 Alamosa Dr
- 2080 Springcrest Rd
- 2020 Springcrest Rd
- 2075 Springcrest Rd
- 2025 Springcrest Rd
- 2060 Bramblwood Ln
- 2040 Bramblwood Ln
- 2110 Springcrest Rd
- 2010 Springcrest Rd
- 2080 Bramblwood Ln
- 2030 Bramblwood Ln
- 2015 Springcrest Rd
- 2115 Springcrest Rd
- 2020 Bramblwood Ln