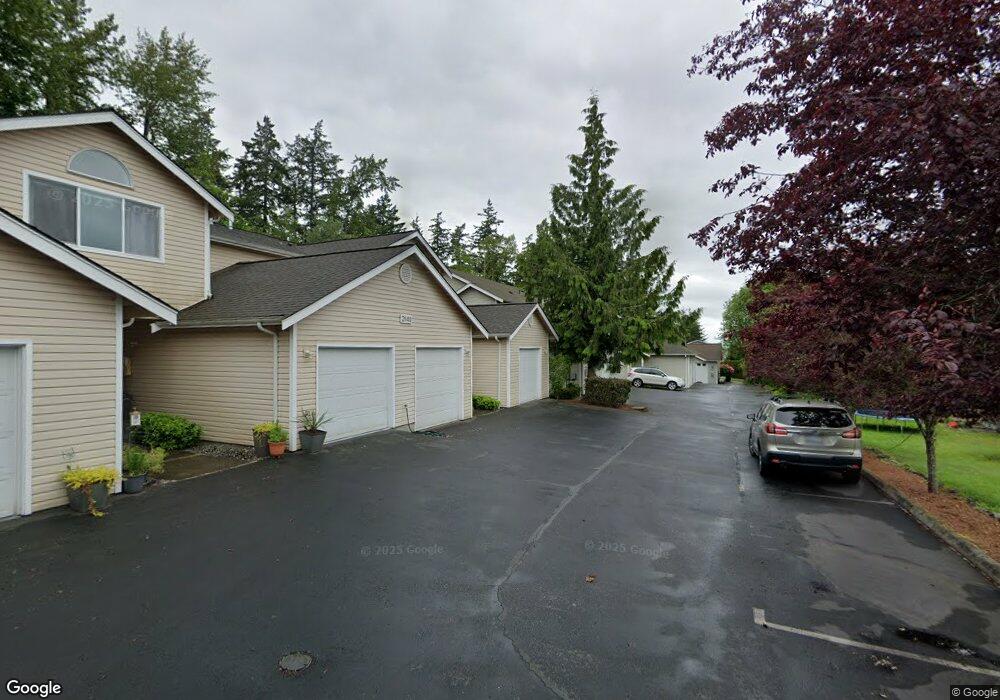
2050 Superior St Unit 2050 Bellingham, WA 98229
Roosevelt NeighborhoodEstimated Value: $467,000 - $528,000
3
Beds
2
Baths
1,338
Sq Ft
$368/Sq Ft
Est. Value
About This Home
This home is located at 2050 Superior St Unit 2050, Bellingham, WA 98229 and is currently estimated at $492,043, approximately $367 per square foot. 2050 Superior St Unit 2050 is a home located in Whatcom County with nearby schools including Roosevelt Elementary School, Kulshan Middle School, and Bellingham High School.
Ownership History
Date
Name
Owned For
Owner Type
Purchase Details
Closed on
Oct 29, 2009
Sold by
Weichert Relocation Resources Inc
Bought by
Donovan Holly A
Current Estimated Value
Home Financials for this Owner
Home Financials are based on the most recent Mortgage that was taken out on this home.
Original Mortgage
$191,468
Outstanding Balance
$125,021
Interest Rate
5%
Mortgage Type
FHA
Estimated Equity
$367,022
Purchase Details
Closed on
Oct 10, 2005
Sold by
Stansfield Christopher J
Bought by
Meier Christian and Mccauley Stephanie
Home Financials for this Owner
Home Financials are based on the most recent Mortgage that was taken out on this home.
Original Mortgage
$23,500
Interest Rate
5.63%
Mortgage Type
Stand Alone Second
Purchase Details
Closed on
Jul 10, 2001
Sold by
City Lights Development Group Llc
Bought by
Stansfield Christopher J
Home Financials for this Owner
Home Financials are based on the most recent Mortgage that was taken out on this home.
Original Mortgage
$100,000
Interest Rate
7.09%
Create a Home Valuation Report for This Property
The Home Valuation Report is an in-depth analysis detailing your home's value as well as a comparison with similar homes in the area
Home Values in the Area
Average Home Value in this Area
Purchase History
| Date | Buyer | Sale Price | Title Company |
|---|---|---|---|
| Donovan Holly A | $195,280 | Chicago Title Insurance | |
| Weichert Relocation Resources Inc | $195,280 | Chicago Title Insurance | |
| Meier Christian | $235,280 | First American Title Insuran | |
| Stansfield Christopher J | $125,000 | Chicago Title Insurance |
Source: Public Records
Mortgage History
| Date | Status | Borrower | Loan Amount |
|---|---|---|---|
| Open | Donovan Holly A | $191,468 | |
| Previous Owner | Meier Christian | $23,500 | |
| Previous Owner | Meier Christian | $188,000 | |
| Previous Owner | Stansfield Christopher J | $100,000 |
Source: Public Records
Tax History Compared to Growth
Tax History
| Year | Tax Paid | Tax Assessment Tax Assessment Total Assessment is a certain percentage of the fair market value that is determined by local assessors to be the total taxable value of land and additions on the property. | Land | Improvement |
|---|---|---|---|---|
| 2024 | $3,543 | $455,110 | $52,640 | $402,470 |
| 2023 | $3,543 | $455,110 | $52,640 | $402,470 |
| 2022 | $3,092 | $376,132 | $43,505 | $332,627 |
| 2021 | $2,978 | $332,860 | $38,500 | $294,360 |
| 2020 | $2,628 | $302,600 | $35,000 | $267,600 |
| 2019 | $2,160 | $258,098 | $31,864 | $226,234 |
| 2018 | $2,284 | $212,738 | $26,264 | $186,474 |
| 2017 | $2,019 | $192,245 | $23,734 | $168,511 |
| 2016 | $1,834 | $177,665 | $21,934 | $155,731 |
| 2015 | $1,828 | $167,945 | $20,734 | $147,211 |
| 2014 | -- | $162,000 | $20,000 | $142,000 |
| 2013 | -- | $164,190 | $19,640 | $144,550 |
Source: Public Records
Map
Nearby Homes
- 2126 Zephyr Place
- 950 Yew St
- 2341 Michigan St
- 2316 Xenia St
- 2330 Verona St
- 2218 Niagara Dr
- 1515 Woburn St
- 2603 Huron St
- 2615 Woburn St
- 2617 Woburn St
- 2619 Woburn St
- 2639 Yew St
- 2321 Crestline Dr
- 2165 Wildflower Way
- 1813 Undine Ln
- 2104 Birch Cir Unit 5C
- 2413 Queen St
- 2809 Valencia St
- 1812 E Maryland St
- 3104 E Maryland St
- 2040 Superior St Unit 202
- 2040 Superior St Unit 201
- 2040 Superior St Unit 102
- 2040 Superior St Unit 101
- 2030 Superior St Unit 102
- 2030 Superior St Unit 202
- 2030 Superior St Unit 201
- 2030 Superior St Unit 102
- 2030 Superior St Unit 101
- 2030 Superior St
- 2052 Superior St
- 2500 Kentucky St
- 2418 Kentucky St
- 2060 Superior St Unit 2060
- 2020 Superior St Unit 202
- 2020 Superior St Unit 201
- 2020 Superior St Unit 102
- 2020 Superior St Unit 101
- 2506 Kentucky St
- 2412 Kentucky St