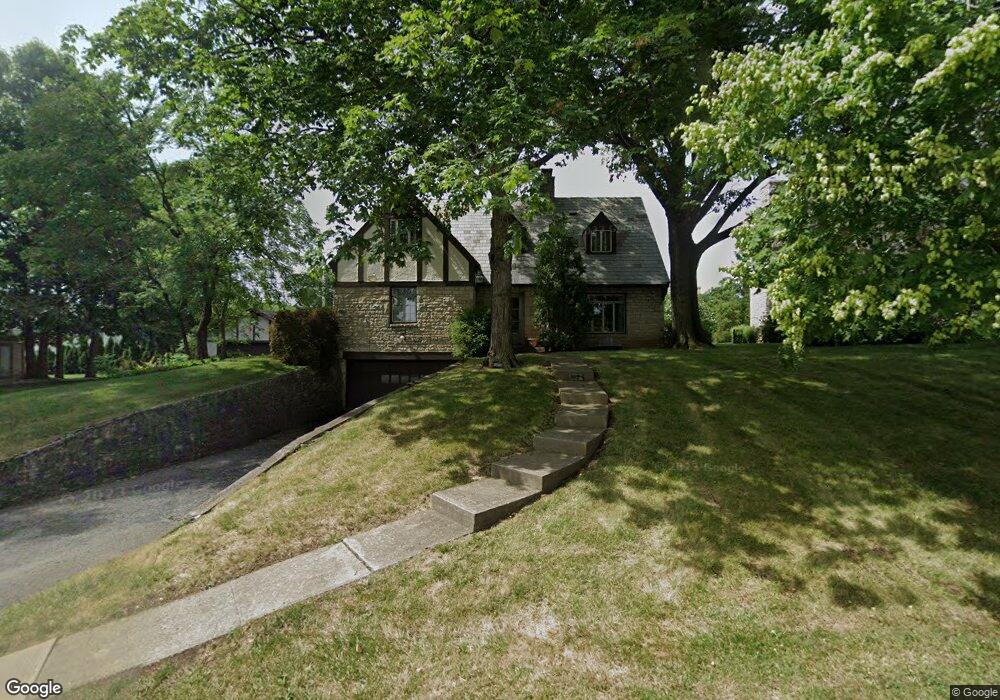
2050 Upper Chelsea Rd Columbus, OH 43221
Estimated Value: $937,000 - $1,176,000
3
Beds
3
Baths
2,275
Sq Ft
$449/Sq Ft
Est. Value
About This Home
This home is located at 2050 Upper Chelsea Rd, Columbus, OH 43221 and is currently estimated at $1,020,886, approximately $448 per square foot. 2050 Upper Chelsea Rd is a home located in Franklin County with nearby schools including Barrington Road Elementary School, Jones Middle School, and Upper Arlington High School.
Ownership History
Date
Name
Owned For
Owner Type
Purchase Details
Closed on
Oct 6, 1993
Bought by
Naffziger A Brooks
Current Estimated Value
Create a Home Valuation Report for This Property
The Home Valuation Report is an in-depth analysis detailing your home's value as well as a comparison with similar homes in the area
Home Values in the Area
Average Home Value in this Area
Purchase History
| Date | Buyer | Sale Price | Title Company |
|---|---|---|---|
| Naffziger A Brooks | -- | -- |
Source: Public Records
Tax History Compared to Growth
Tax History
| Year | Tax Paid | Tax Assessment Tax Assessment Total Assessment is a certain percentage of the fair market value that is determined by local assessors to be the total taxable value of land and additions on the property. | Land | Improvement |
|---|---|---|---|---|
| 2024 | $16,781 | $299,670 | $143,010 | $156,660 |
| 2023 | $16,609 | $299,670 | $143,010 | $156,660 |
| 2022 | $11,691 | $176,060 | $113,580 | $62,480 |
| 2021 | $10,349 | $176,060 | $113,580 | $62,480 |
| 2020 | $10,258 | $176,060 | $113,580 | $62,480 |
| 2019 | $11,602 | $176,060 | $113,580 | $62,480 |
| 2018 | $10,347 | $193,700 | $113,580 | $80,120 |
| 2017 | $12,727 | $193,700 | $113,580 | $80,120 |
| 2016 | $7,949 | $128,980 | $84,670 | $44,310 |
| 2015 | $7,943 | $128,980 | $84,670 | $44,310 |
| 2014 | $7,952 | $128,980 | $84,670 | $44,310 |
| 2013 | $3,770 | $117,250 | $76,965 | $40,285 |
Source: Public Records
Map
Nearby Homes
- 2063 Westover Rd
- 1631 Roxbury Rd Unit F3
- 1631 Roxbury Rd Unit B6
- 2170 Lane Woods Dr Unit 2170
- 2015 W 5th Ave Unit 211
- 2015 W 5th Ave Unit 102
- 2015 W 5th Ave Unit 108
- 1869 Tewksbury Rd
- 1782 Wyandotte Rd
- 2110 Northwest Blvd
- 2704 Scioto Station Dr Unit 2704
- 2754 Scioto Station Dr
- 2583 Wexford Rd
- 1733 Elmwood Ave
- 1561 Glenn Ave
- 1914 Elmwood Ave
- 2792 Kobuk Dr
- 2842 Gunnison Dr Unit 402
- 2842 Gunnison Dr Unit 403
- 2842 Gunnison Dr Unit 203
- 2064 Upper Chelsea Rd
- 2040 Upper Chelsea Rd
- 2215 Cambridge Blvd
- 2201 Cambridge Blvd
- 2225 Cambridge Blvd
- 2057 Upper Chelsea Rd
- 2076 Upper Chelsea Rd
- 2045 Upper Chelsea Rd
- 2237 Cambridge Blvd
- 2030 Upper Chelsea Rd
- 2185 Cambridge Blvd
- 2029 Upper Chelsea Rd
- 2086 Upper Chelsea Rd
- 2019 Upper Chelsea Rd
- 2251 Cambridge Blvd
- 2020 Upper Chelsea Rd
- 2175 Cambridge Blvd
- 1980 Hillside Dr
- 1980 Hampshire Rd
- 1990 Hampshire Rd