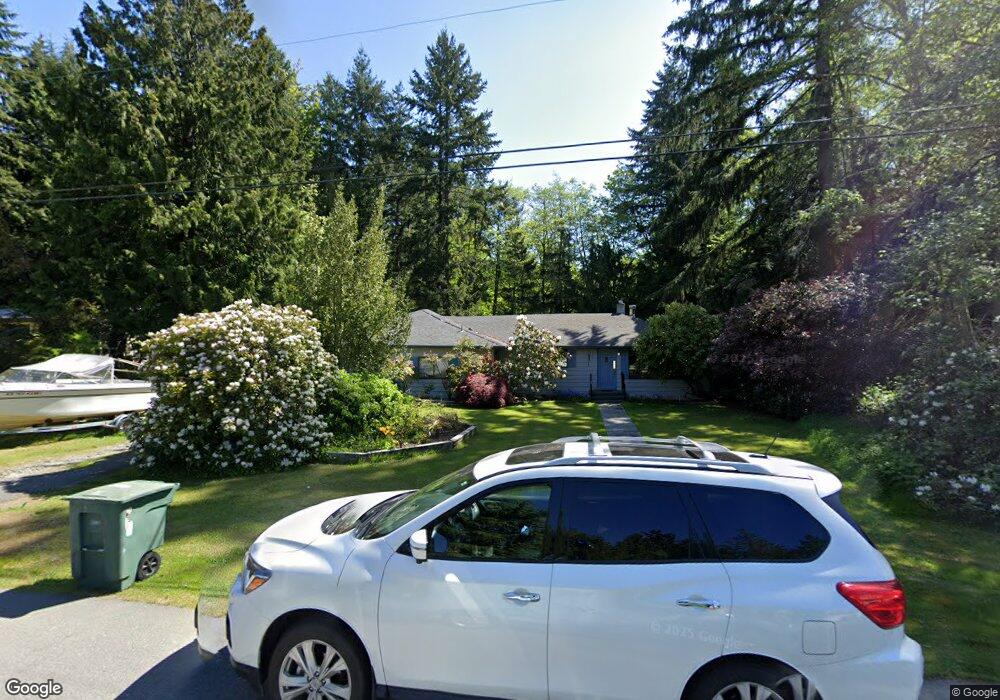
20501 85th Place W Edmonds, WA 98026
East Edmonds NeighborhoodEstimated Value: $903,540 - $1,105,000
3
Beds
1
Bath
1,634
Sq Ft
$612/Sq Ft
Est. Value
About This Home
This home is located at 20501 85th Place W, Edmonds, WA 98026 and is currently estimated at $1,000,135, approximately $612 per square foot. 20501 85th Place W is a home located in Snohomish County with nearby schools including Edmonds Elementary School, College Place Middle School, and Edmonds-Woodway High School.
Ownership History
Date
Name
Owned For
Owner Type
Purchase Details
Closed on
Dec 2, 2019
Sold by
Grant Frederick W and Grant Frederick Wells
Bought by
Grant Frederick W and Grant Iryna Soklova
Current Estimated Value
Home Financials for this Owner
Home Financials are based on the most recent Mortgage that was taken out on this home.
Original Mortgage
$423,377
Outstanding Balance
$374,359
Interest Rate
3.75%
Mortgage Type
VA
Estimated Equity
$625,776
Purchase Details
Closed on
Jan 6, 2017
Sold by
Soklova Iryna
Bought by
Grant Frederick W
Home Financials for this Owner
Home Financials are based on the most recent Mortgage that was taken out on this home.
Original Mortgage
$297,562
Interest Rate
4.08%
Mortgage Type
VA
Purchase Details
Closed on
May 10, 2006
Sold by
Grant Starr L
Bought by
Grant Frederick W
Purchase Details
Closed on
Jun 15, 1999
Sold by
Irving Susan L
Bought by
Irving Richard E
Create a Home Valuation Report for This Property
The Home Valuation Report is an in-depth analysis detailing your home's value as well as a comparison with similar homes in the area
Home Values in the Area
Average Home Value in this Area
Purchase History
| Date | Buyer | Sale Price | Title Company |
|---|---|---|---|
| Grant Frederick W | -- | First American Title Ins Co | |
| Grant Frederick W | -- | Ticor Title | |
| Grant Frederick W | -- | None Available | |
| Irving Richard E | -- | -- |
Source: Public Records
Mortgage History
| Date | Status | Borrower | Loan Amount |
|---|---|---|---|
| Open | Grant Frederick W | $423,377 | |
| Closed | Grant Frederick W | $297,562 |
Source: Public Records
Tax History Compared to Growth
Tax History
| Year | Tax Paid | Tax Assessment Tax Assessment Total Assessment is a certain percentage of the fair market value that is determined by local assessors to be the total taxable value of land and additions on the property. | Land | Improvement |
|---|---|---|---|---|
| 2025 | $5,591 | $812,900 | $654,200 | $158,700 |
| 2024 | $5,591 | $788,700 | $626,900 | $161,800 |
| 2023 | $5,672 | $829,200 | $653,100 | $176,100 |
| 2022 | $5,491 | $660,100 | $527,000 | $133,100 |
| 2020 | $5,116 | $548,700 | $416,000 | $132,700 |
| 2019 | $4,733 | $513,400 | $383,000 | $130,400 |
| 2018 | $4,740 | $444,300 | $328,000 | $116,300 |
| 2017 | $3,949 | $387,700 | $285,000 | $102,700 |
| 2016 | $3,623 | $352,700 | $254,000 | $98,700 |
| 2015 | $3,649 | $334,500 | $243,000 | $91,500 |
| 2013 | $3,068 | $265,500 | $182,000 | $83,500 |
Source: Public Records
Map
Nearby Homes
- 20126 81st Ave W
- 8004 203rd Place SW
- 8427 200th St SW
- 20721 81st Ave W
- 8804 209th Place SW
- 8732 209th Place SW
- 20111 80th Ave W
- 8500 Main St Unit F313
- 8500 Main St Unit F-209
- 8500 Main St Unit F205
- 8502 Main St Unit E105
- 228 xx 84th Ave W
- 8225 212th St SW Unit 304
- 7707 203rd St SW
- 21224 82nd Place W
- 8516 196th St SW Unit 105
- 8516 196th St SW Unit 302
- 8516 196th St SW Unit 206
- 8516 196th St SW Unit 311
- 7702 202nd Place SW
- 20429 85th Place W
- 20521 85th Place W
- 20500 85th Place W
- 20508 85th Place W
- 20420 85th Place W
- 20520 85th Place W
- 20405 85th Place W
- 20531 85th Place W
- 8522 204th St SW
- 20530 85th Place W
- 20607 85th Place W
- 8604 204th St SW
- 20501 86th Place W
- 20505 86th Place W
- 20509 86th Place W
- 20427 86th Place W
- 20310 84th Place W
- 8507 204th St SW
- 20610 85th Place W