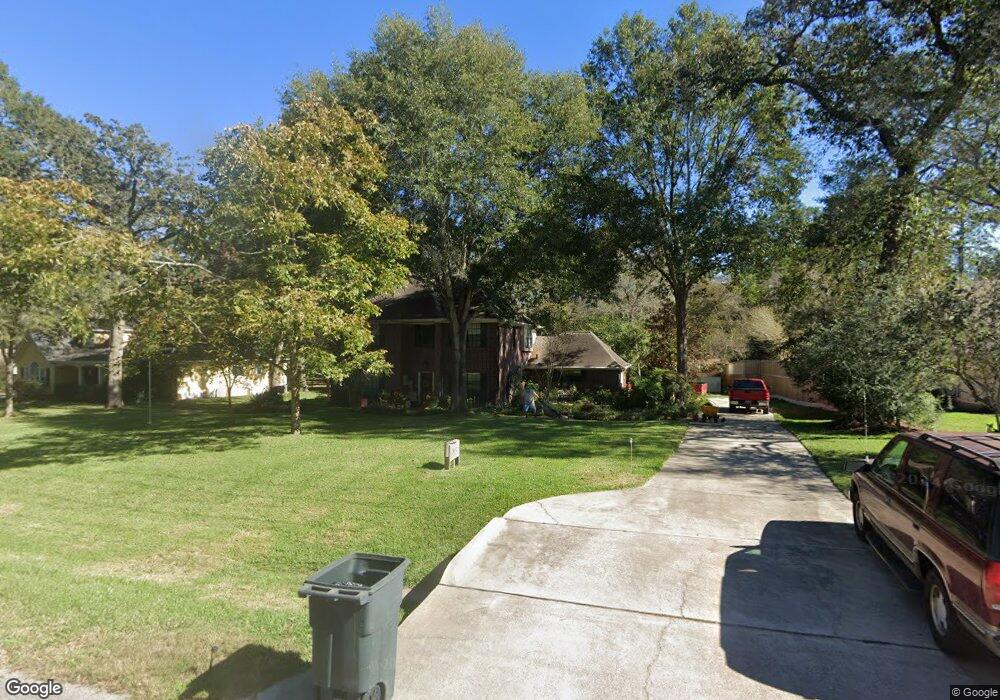
20502 Victorious Dr Hockley, TX 77447
Estimated Value: $561,288 - $633,000
4
Beds
3
Baths
2,885
Sq Ft
$208/Sq Ft
Est. Value
About This Home
This home is located at 20502 Victorious Dr, Hockley, TX 77447 and is currently estimated at $600,822, approximately $208 per square foot. 20502 Victorious Dr is a home located in Harris County with nearby schools including Evelyn Turlington Elementary School, Schultz Junior High School, and Waller High School.
Ownership History
Date
Name
Owned For
Owner Type
Purchase Details
Closed on
Apr 29, 1996
Sold by
Johnson Sam L and Johnson Celeste
Bought by
Schilling Mark W and Schilling Michele A M
Current Estimated Value
Home Financials for this Owner
Home Financials are based on the most recent Mortgage that was taken out on this home.
Original Mortgage
$133,750
Outstanding Balance
$6,189
Interest Rate
5.87%
Estimated Equity
$594,633
Purchase Details
Closed on
Mar 6, 1996
Sold by
Powder Mill Estates Inc
Bought by
Johnson Sam L and Johnson Celeste K
Home Financials for this Owner
Home Financials are based on the most recent Mortgage that was taken out on this home.
Original Mortgage
$133,750
Outstanding Balance
$6,189
Interest Rate
5.87%
Estimated Equity
$594,633
Create a Home Valuation Report for This Property
The Home Valuation Report is an in-depth analysis detailing your home's value as well as a comparison with similar homes in the area
Home Values in the Area
Average Home Value in this Area
Purchase History
| Date | Buyer | Sale Price | Title Company |
|---|---|---|---|
| Schilling Mark W | -- | -- | |
| Johnson Sam L | -- | Title Agency #50 |
Source: Public Records
Mortgage History
| Date | Status | Borrower | Loan Amount |
|---|---|---|---|
| Open | Schilling Mark W | $133,750 | |
| Previous Owner | Johnson Sam L | $35,910 |
Source: Public Records
Tax History Compared to Growth
Tax History
| Year | Tax Paid | Tax Assessment Tax Assessment Total Assessment is a certain percentage of the fair market value that is determined by local assessors to be the total taxable value of land and additions on the property. | Land | Improvement |
|---|---|---|---|---|
| 2025 | $3,168 | $561,036 | $112,050 | $448,986 |
| 2024 | $3,168 | $496,644 | $93,375 | $403,269 |
| 2023 | $3,168 | $519,042 | $93,375 | $425,667 |
| 2022 | $7,370 | $404,028 | $84,038 | $319,990 |
| 2021 | $6,950 | $330,054 | $84,038 | $246,016 |
| 2020 | $6,970 | $318,763 | $84,038 | $234,725 |
| 2019 | $7,727 | $339,607 | $63,495 | $276,112 |
| 2018 | $2,216 | $313,004 | $63,495 | $249,509 |
| 2017 | $6,996 | $313,004 | $63,495 | $249,509 |
| 2016 | $6,763 | $302,564 | $63,495 | $239,069 |
| 2015 | $1,548 | $302,564 | $63,495 | $239,069 |
| 2014 | $1,548 | $251,021 | $48,555 | $202,466 |
Source: Public Records
Map
Nearby Homes
- 23114 Cardinal Dr
- 20306 Courageous Dr
- 21815 Fearless Dr
- 23515 Cardinal Dr
- 20719 New Kentucky Village Dr
- 0 Roberts Cemetery Rd Unit 36689208
- 22019 Robins Rd
- 22327 Three Pines Dr
- 21701 Glenmont Blvd
- 21334 Farm To Market Road 2920
- TBD Farm To Market Road 2920
- 21310 Barcelona Heights Trail
- 21010 Red Arbutus Ct
- 22914 Three Pines Dr
- 0 Prop Id 101208 Unit 35069205
- 21843 Carballo Oak Trail
- 20910 Holm Oak Way
- 21914 Hibiscus Hedge Trail
- 21410 Villa Spruce Ln
- 21006 Yellow Ipe Grove Ct
- 20506 Victorious Dr
- 20422 Victorious Dr
- 21602 Frontiersman Ct
- 20510 Victorious Dr
- 20418 Victorious Dr
- 21603 Frontiersman Ct
- 21606 Frontiersman Ct
- 20507 Victorious Dr
- 21607 Frontiersman Ct
- 23003 Cardinal Dr
- 20518 Victorious Dr
- 23011 Cardinal Dr
- 21610 Frontiersman Ct
- 20410 Victorious Dr
- 21606 Fearless Dr
- 20519 Victorious Dr
- 21611 Frontiersman Ct
- 20522 Victorious Dr
- 23015 Cardinal Dr
- 21614 Frontiersman Ct