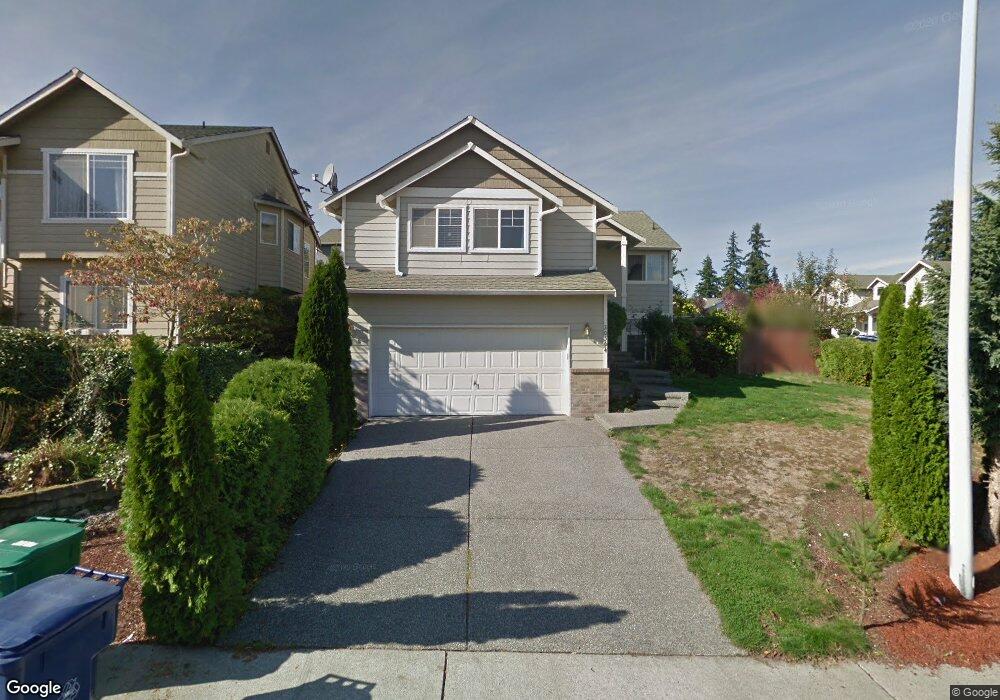
20504 2nd Dr SE Bothell, WA 98012
Queensborough-Brentwood NeighborhoodEstimated Value: $848,000 - $1,031,009
5
Beds
3
Baths
2,438
Sq Ft
$395/Sq Ft
Est. Value
About This Home
This home is located at 20504 2nd Dr SE, Bothell, WA 98012 and is currently estimated at $963,252, approximately $395 per square foot. 20504 2nd Dr SE is a home located in Snohomish County with nearby schools including Frank Love Elementary School, Kenmore Middle School, and Bothell High School.
Ownership History
Date
Name
Owned For
Owner Type
Purchase Details
Closed on
Mar 29, 2002
Sold by
Jawad Shubber Bann
Bought by
Shubber Adel H
Current Estimated Value
Home Financials for this Owner
Home Financials are based on the most recent Mortgage that was taken out on this home.
Original Mortgage
$217,200
Outstanding Balance
$82,330
Interest Rate
5.75%
Estimated Equity
$880,922
Purchase Details
Closed on
Mar 20, 2002
Sold by
Lee Thomas Young
Bought by
Shubber Adel H
Home Financials for this Owner
Home Financials are based on the most recent Mortgage that was taken out on this home.
Original Mortgage
$217,200
Outstanding Balance
$82,330
Interest Rate
5.75%
Estimated Equity
$880,922
Purchase Details
Closed on
May 11, 1999
Sold by
Crosby Homes Inc
Bought by
Lee Thomas Young
Home Financials for this Owner
Home Financials are based on the most recent Mortgage that was taken out on this home.
Original Mortgage
$178,490
Interest Rate
6.94%
Create a Home Valuation Report for This Property
The Home Valuation Report is an in-depth analysis detailing your home's value as well as a comparison with similar homes in the area
Home Values in the Area
Average Home Value in this Area
Purchase History
| Date | Buyer | Sale Price | Title Company |
|---|---|---|---|
| Shubber Adel H | -- | Lawyers Title Agency | |
| Shubber Adel H | $271,500 | Lawyers Title Agency | |
| Lee Thomas Young | $237,990 | Chicago Title Insurance Co |
Source: Public Records
Mortgage History
| Date | Status | Borrower | Loan Amount |
|---|---|---|---|
| Open | Shubber Adel H | $217,200 | |
| Previous Owner | Lee Thomas Young | $178,490 |
Source: Public Records
Tax History
| Year | Tax Paid | Tax Assessment Tax Assessment Total Assessment is a certain percentage of the fair market value that is determined by local assessors to be the total taxable value of land and additions on the property. | Land | Improvement |
|---|---|---|---|---|
| 2025 | $7,120 | $866,500 | $517,800 | $348,700 |
| 2024 | $7,120 | $835,700 | $498,800 | $336,900 |
| 2023 | $7,618 | $968,500 | $579,500 | $389,000 |
| 2022 | $6,689 | $681,000 | $347,700 | $333,300 |
| 2020 | $6,255 | $573,600 | $287,900 | $285,700 |
| 2019 | $5,574 | $515,300 | $237,500 | $277,800 |
| 2018 | $5,254 | $457,600 | $209,000 | $248,600 |
| 2017 | $4,587 | $402,700 | $171,000 | $231,700 |
| 2016 | $4,479 | $383,700 | $161,500 | $222,200 |
Source: Public Records
Map
Nearby Homes
- 309 207th Place SE
- 105 202nd St SE
- 300 208th St SE
- 429 203rd Place SE
- 110 204th Place SW
- 20911 W Richmond Rd
- 618 203rd St SE
- 130 203rd Place SW
- 24 199th Place SE
- 20029 7th Ave SE
- 20902 2nd Ave W
- 20912 2nd Ave W
- 19726 Filbert Dr
- 820 Grimes Rd
- 21120 Meridian Place W
- 738 211th Place SE
- 722 211th Place SE
- 721 211th Place SE
- 729 211th Place SE
- 809 211th Place SE
- 20508 2nd Dr SE
- 20409 2nd Ave SE
- 211 Nellis Rd
- 20405 2nd Ave SE
- 209 Nellis Rd
- 20512 2nd Dr SE
- 213 Nellis Rd
- 224 Nellis Rd
- 20413 2nd Ave SE
- 207 Nellis Rd
- 215 Nellis Rd
- 20516 2nd Dr SE
- 205 Nellis Rd
- 210 203rd St SE
- 20511 2nd Dr SE
- 208 203rd St SE
- 214 203rd St SE
- 20417 2nd Ave SE
- 206 203rd St SE
- 217 Nellis Rd
Your Personal Tour Guide
Ask me questions while you tour the home.