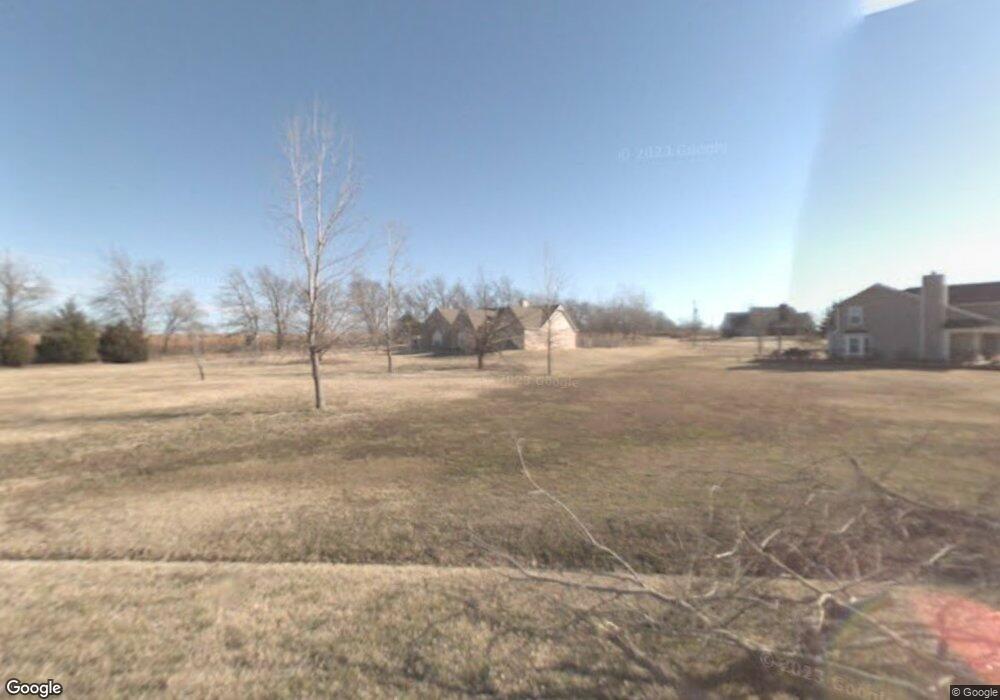
20505 Rockport Dr Claremore, OK 74019
Estimated Value: $357,000 - $403,168
4
Beds
3
Baths
2,663
Sq Ft
$144/Sq Ft
Est. Value
About This Home
This home is located at 20505 Rockport Dr, Claremore, OK 74019 and is currently estimated at $382,292, approximately $143 per square foot. 20505 Rockport Dr is a home located in Rogers County with nearby schools including Westside Elementary School, Will Rogers Junior High School, and Claremore High School.
Ownership History
Date
Name
Owned For
Owner Type
Purchase Details
Closed on
Mar 10, 2009
Sold by
Aurora Loan Services Llc
Bought by
Hassell Dawain and Hassell Corie
Current Estimated Value
Home Financials for this Owner
Home Financials are based on the most recent Mortgage that was taken out on this home.
Original Mortgage
$186,558
Outstanding Balance
$118,619
Interest Rate
5.21%
Mortgage Type
FHA
Estimated Equity
$263,673
Purchase Details
Closed on
Jan 14, 2009
Sold by
Pearce Jeffrey R and Pearce Ginny R
Bought by
American Home Mortgage Servicing Inc
Home Financials for this Owner
Home Financials are based on the most recent Mortgage that was taken out on this home.
Original Mortgage
$186,558
Outstanding Balance
$118,619
Interest Rate
5.21%
Mortgage Type
FHA
Estimated Equity
$263,673
Purchase Details
Closed on
Sep 17, 2004
Sold by
Wirth Ross A
Purchase Details
Closed on
Sep 15, 1994
Sold by
Probst Steven C
Purchase Details
Closed on
Jul 2, 1993
Sold by
Beale Company Builders Inc
Purchase Details
Closed on
Apr 14, 1993
Sold by
Probst Steven C
Purchase Details
Closed on
Oct 30, 1992
Sold by
Dohrer Roger P
Purchase Details
Closed on
Jul 19, 1991
Sold by
Weststar Bank
Create a Home Valuation Report for This Property
The Home Valuation Report is an in-depth analysis detailing your home's value as well as a comparison with similar homes in the area
Home Values in the Area
Average Home Value in this Area
Purchase History
| Date | Buyer | Sale Price | Title Company |
|---|---|---|---|
| Hassell Dawain | $190,000 | Rogers County Abstract | |
| American Home Mortgage Servicing Inc | $65,566 | None Available | |
| -- | $221,500 | -- | |
| -- | $140,000 | -- | |
| -- | $133,000 | -- | |
| -- | -- | -- | |
| -- | $11,500 | -- | |
| -- | $7,500 | -- |
Source: Public Records
Mortgage History
| Date | Status | Borrower | Loan Amount |
|---|---|---|---|
| Open | Hassell Dawain | $186,558 |
Source: Public Records
Tax History Compared to Growth
Tax History
| Year | Tax Paid | Tax Assessment Tax Assessment Total Assessment is a certain percentage of the fair market value that is determined by local assessors to be the total taxable value of land and additions on the property. | Land | Improvement |
|---|---|---|---|---|
| 2025 | $3,163 | $31,499 | $3,347 | $28,152 |
| 2024 | $3,163 | $30,582 | $3,250 | $27,332 |
| 2023 | $3,163 | $29,691 | $2,750 | $26,941 |
| 2022 | $2,971 | $28,826 | $2,750 | $26,076 |
| 2021 | $2,764 | $28,331 | $2,750 | $25,581 |
| 2020 | $2,779 | $27,852 | $2,750 | $25,102 |
| 2019 | $2,723 | $26,668 | $2,750 | $23,918 |
| 2018 | $2,636 | $26,381 | $2,750 | $23,631 |
| 2017 | $2,514 | $24,866 | $2,750 | $22,116 |
| 2016 | $2,509 | $24,142 | $2,750 | $21,392 |
| 2015 | $2,345 | $23,439 | $2,750 | $20,689 |
| 2014 | $2,285 | $22,756 | $2,750 | $20,006 |
Source: Public Records
Map
Nearby Homes
- 9376 Colonial Dr
- 3203 Callaway Dr
- 3110 Callaway Dr
- 3311 Heritage Dr
- 3205 Heritage Dr
- 3011 W Berwick St
- 3112 W Berwick St
- 20525 S 4120 Rd
- 3106 W Berwick St
- 3112 Club St
- 20612 S 4120 Rd
- 511 Glencoe Cir
- 3317 Fairway St
- 3311 Fairway St
- 3334 Fairway St
- 9060 E Prairie View Dr
- 20072 S 4120 Rd
- 20302 S River Ranch Rd W
- 616 Westwood Dr
- 2404 S Maywood Dr
- 9705 Marblehead Dr
- 0 Rockport Dr
- 9647 Marblehead Dr
- 9724 Marblehead Dr
- 9634 Marblehead Dr
- 9623 Marblehead Dr
- 9744 Marblehead Dr
- 20605 Lynn Cir
- 9445 Colonial Dr
- 9603 Colonial Dr
- 9625 Colonial Dr
- 9605 Marblehead Dr
- 20608 Colonial Dr
- 9627 Colonial Dr
- 3300 Holly Rd
- 9555 Arlington Ct
- 9534 Colonial Dr
- 9629 Colonial Dr
- 20806 Liberty Ln
- 20835 Liberty Ln