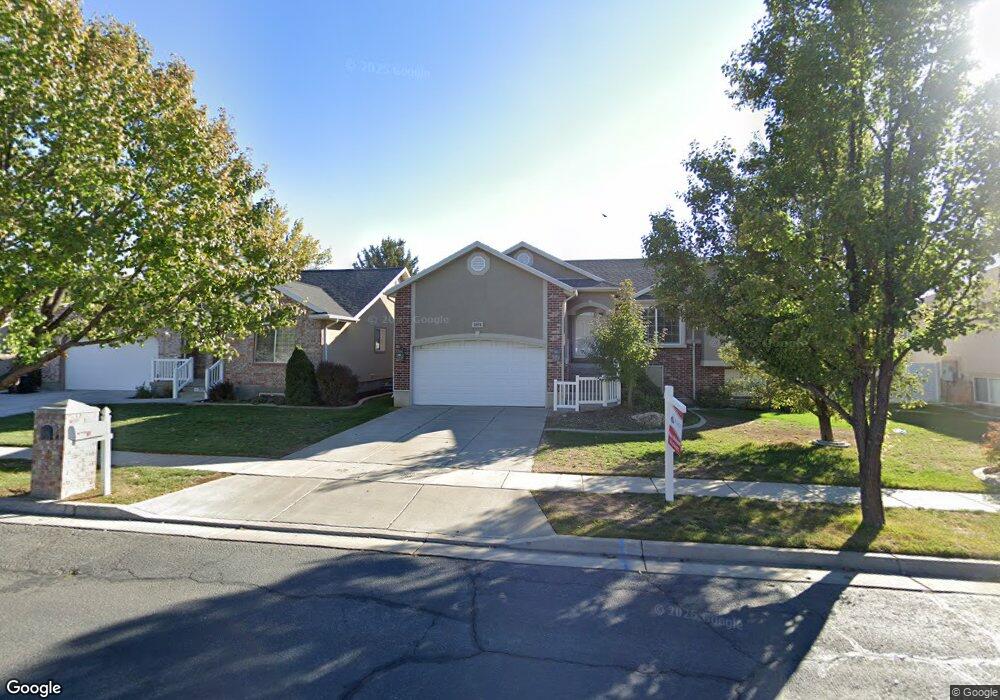
2051 Craig Ln Syracuse, UT 84075
Estimated Value: $493,000 - $513,562
4
Beds
3
Baths
2,594
Sq Ft
$193/Sq Ft
Est. Value
About This Home
This home is located at 2051 Craig Ln, Syracuse, UT 84075 and is currently estimated at $501,141, approximately $193 per square foot. 2051 Craig Ln is a home located in Davis County with nearby schools including Syracuse Elementary School, Syracuse Junior High School, and Syracuse High School.
Ownership History
Date
Name
Owned For
Owner Type
Purchase Details
Closed on
Mar 21, 2023
Sold by
Mortensen Devoy L
Bought by
Hayden Judd Brock and Hayden Kerri Judd
Current Estimated Value
Home Financials for this Owner
Home Financials are based on the most recent Mortgage that was taken out on this home.
Original Mortgage
$24,271
Outstanding Balance
$23,480
Interest Rate
6.12%
Estimated Equity
$477,661
Purchase Details
Closed on
Nov 21, 2005
Sold by
Dreambuilders Inc
Bought by
Mortensen Devoy L and Mortensen Donna Rue
Purchase Details
Closed on
Apr 16, 2004
Sold by
Rkt Holding Co Inc
Bought by
Dreambuilders Inc
Home Financials for this Owner
Home Financials are based on the most recent Mortgage that was taken out on this home.
Original Mortgage
$151,993
Interest Rate
5.57%
Mortgage Type
Purchase Money Mortgage
Purchase Details
Closed on
May 14, 2001
Sold by
Cheney Financial Services Inc
Bought by
Rkt Holding Company Inc
Create a Home Valuation Report for This Property
The Home Valuation Report is an in-depth analysis detailing your home's value as well as a comparison with similar homes in the area
Home Values in the Area
Average Home Value in this Area
Purchase History
| Date | Buyer | Sale Price | Title Company |
|---|---|---|---|
| Hayden Judd Brock | -- | Cottonwood Title | |
| Mortensen Devoy L | -- | Heritage West Title Ins Agen | |
| Dreambuilders Inc | -- | Heritage West Title Ins | |
| Rkt Holding Company Inc | -- | Bonneville Title Company Inc |
Source: Public Records
Mortgage History
| Date | Status | Borrower | Loan Amount |
|---|---|---|---|
| Open | Hayden Judd Brock | $24,271 | |
| Open | Hayden Judd Brock | $459,523 | |
| Previous Owner | Dreambuilders Inc | $151,993 |
Source: Public Records
Tax History Compared to Growth
Tax History
| Year | Tax Paid | Tax Assessment Tax Assessment Total Assessment is a certain percentage of the fair market value that is determined by local assessors to be the total taxable value of land and additions on the property. | Land | Improvement |
|---|---|---|---|---|
| 2025 | $2,885 | $278,300 | $112,644 | $165,656 |
| 2024 | $2,746 | $266,750 | $82,684 | $184,066 |
| 2023 | $2,565 | $454,000 | $115,777 | $338,223 |
| 2022 | $700 | $261,250 | $68,022 | $193,228 |
| 2021 | $506 | $354,000 | $99,377 | $254,623 |
| 2020 | $594 | $307,000 | $91,741 | $215,259 |
| 2019 | $582 | $295,000 | $83,394 | $211,606 |
| 2018 | $530 | $267,000 | $83,860 | $183,140 |
| 2016 | $435 | $115,830 | $32,420 | $83,410 |
| 2015 | $1,539 | $109,505 | $32,420 | $77,085 |
| 2014 | $1,516 | $109,955 | $32,420 | $77,535 |
| 2013 | -- | $108,618 | $25,850 | $82,768 |
Source: Public Records
Map
Nearby Homes
- 2047 S 2000 W
- 2104 W 2200 S
- 2136 W 2200 S
- 1932 S 2150 W
- 2194 S 1800 W
- 2000 S 1800 W
- 2297 W 2175 S
- 2082 S 1730 W
- 1836 W 2400 S
- 2503 S 1875 W
- 4344 W 1825 S Unit 102
- 4354 W 1825 S Unit 104
- 4348 W 1825 S Unit 103
- 1918 S 2465 W
- 2208 W 2615 S Unit 141
- 2198 W 2615 S Unit 140
- 2158 W 2615 S Unit 137
- 2650 S 2000 W
- 1641 S 2350 W Unit B
- 2402 W 2700 S