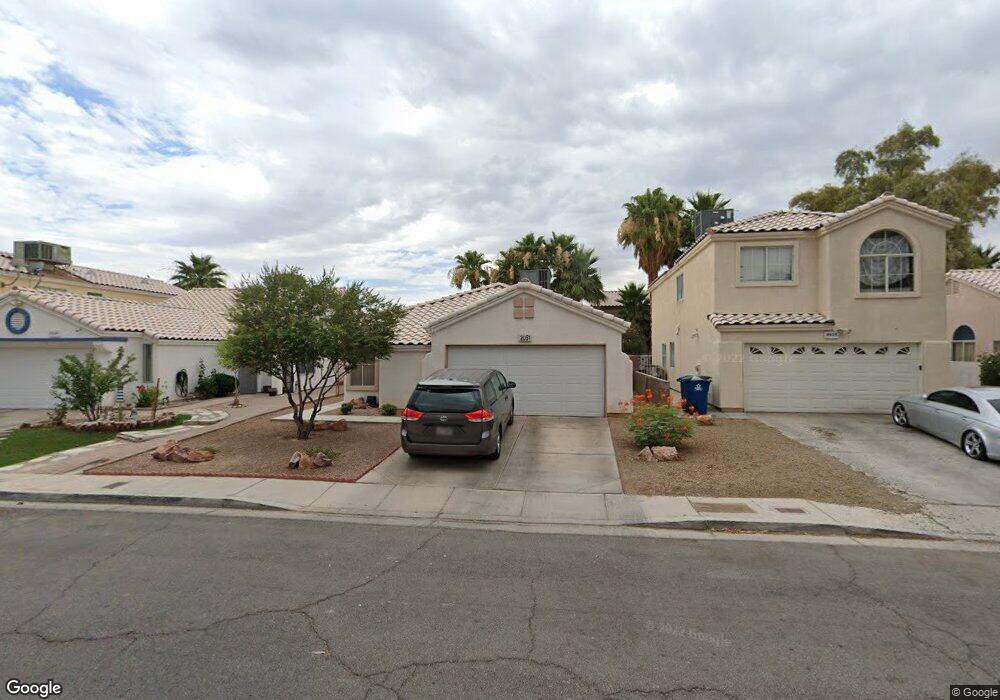
2051 Jade Canyon Cir Las Vegas, NV 89142
Estimated Value: $348,309 - $383,000
3
Beds
2
Baths
1,310
Sq Ft
$282/Sq Ft
Est. Value
About This Home
This home is located at 2051 Jade Canyon Cir, Las Vegas, NV 89142 and is currently estimated at $369,827, approximately $282 per square foot. 2051 Jade Canyon Cir is a home located in Clark County with nearby schools including Dan Goldfarb Elementary School, Kathleen & Tim Harney Middle School, and Las Vegas High School.
Ownership History
Date
Name
Owned For
Owner Type
Purchase Details
Closed on
Oct 30, 2002
Sold by
Ulrich Merlyn R and Ulrich Linda L
Bought by
Barney Scott L and Barney Esther F
Current Estimated Value
Home Financials for this Owner
Home Financials are based on the most recent Mortgage that was taken out on this home.
Original Mortgage
$110,400
Interest Rate
5.99%
Purchase Details
Closed on
Jun 21, 1996
Sold by
Ulrich Merlyn R and Ulrich Linda L
Bought by
Ulrich Merlyn R and Ulrich Linda L
Purchase Details
Closed on
Jun 8, 1995
Sold by
Tindall Francis
Bought by
Ulrich Merlyn R and Ulrich Linda L
Home Financials for this Owner
Home Financials are based on the most recent Mortgage that was taken out on this home.
Original Mortgage
$64,000
Interest Rate
7.88%
Purchase Details
Closed on
Jan 10, 1995
Sold by
Tindall Francis and Tindall Fern
Bought by
Tindall Francis
Purchase Details
Closed on
Dec 20, 1994
Sold by
Lewis Properties
Bought by
Tindall Francis
Create a Home Valuation Report for This Property
The Home Valuation Report is an in-depth analysis detailing your home's value as well as a comparison with similar homes in the area
Home Values in the Area
Average Home Value in this Area
Purchase History
| Date | Buyer | Sale Price | Title Company |
|---|---|---|---|
| Barney Scott L | $138,000 | Pioneer National Title Ins | |
| Ulrich Merlyn R | -- | -- | |
| Ulrich Merlyn R | $80,000 | Fidelity National Title | |
| Tindall Francis | -- | Land Title | |
| Tindall Francis | $101,000 | Land Title |
Source: Public Records
Mortgage History
| Date | Status | Borrower | Loan Amount |
|---|---|---|---|
| Previous Owner | Barney Scott L | $110,400 | |
| Previous Owner | Ulrich Merlyn R | $64,000 | |
| Closed | Barney Scott L | $20,700 |
Source: Public Records
Tax History Compared to Growth
Tax History
| Year | Tax Paid | Tax Assessment Tax Assessment Total Assessment is a certain percentage of the fair market value that is determined by local assessors to be the total taxable value of land and additions on the property. | Land | Improvement |
|---|---|---|---|---|
| 2025 | $1,055 | $73,022 | $24,850 | $48,172 |
| 2024 | $1,025 | $73,022 | $24,850 | $48,172 |
| 2023 | $1,025 | $74,495 | $28,700 | $45,795 |
| 2022 | $995 | $65,544 | $23,450 | $42,094 |
| 2021 | $966 | $61,422 | $21,350 | $40,072 |
| 2020 | $935 | $60,526 | $20,650 | $39,876 |
| 2019 | $908 | $57,281 | $17,850 | $39,431 |
| 2018 | $882 | $52,053 | $13,965 | $38,088 |
| 2017 | $1,525 | $52,001 | $13,300 | $38,701 |
| 2016 | $836 | $42,858 | $9,450 | $33,408 |
| 2015 | $833 | $35,335 | $8,050 | $27,285 |
| 2014 | $809 | $28,629 | $7,000 | $21,629 |
Source: Public Records
Map
Nearby Homes
- 1927 Raspberry Hill Rd
- 2179 Raspberry Hill Rd
- 6131 Pumpkin Patch Ave
- 1950 Turtlerock St
- 1779 Pineapple Tree Ct
- 6092 Golden Nectar Way
- 1747 Angel Falls St
- 6233 Apple Orchard Dr
- 6094 Bing Cherry Dr
- 6276 Back Woods Rd
- 6058 Grape Blossom Ave
- 6080 Saint Petersburg Dr
- 5849 Emerald Canyon Dr
- 6053 Wild Berry Dr
- 6028 Las Nubes Dr
- 6170 E Sahara Ave Unit 1031
- 6170 E Sahara Ave Unit 1076
- 6170 E Sahara Ave Unit 1111
- 6311 American Beauty Ave
- 2316 Tulip Field St
- 2069 Jade Canyon Cir
- 6045 Iris Garden Cir
- 2029 Jade Canyon Cir
- 2077 Jade Canyon Cir
- 6044 American Beauty Ave
- 6039 Iris Garden Cir
- 2017 Jade Canyon Cir
- 6038 American Beauty Ave
- 2044 Jade Canyon Cir
- 2064 Jade Canyon Cir
- 2032 Jade Canyon Cir
- 6033 Iris Garden Cir
- 2072 Jade Canyon Cir
- 6032 American Beauty Ave
- 6046 Iris Garden Cir
- 2018 Jade Canyon Cir
- 2116 Eclair Cir Unit 43
- 6025 Iris Garden Cir
- 6024 American Beauty Ave