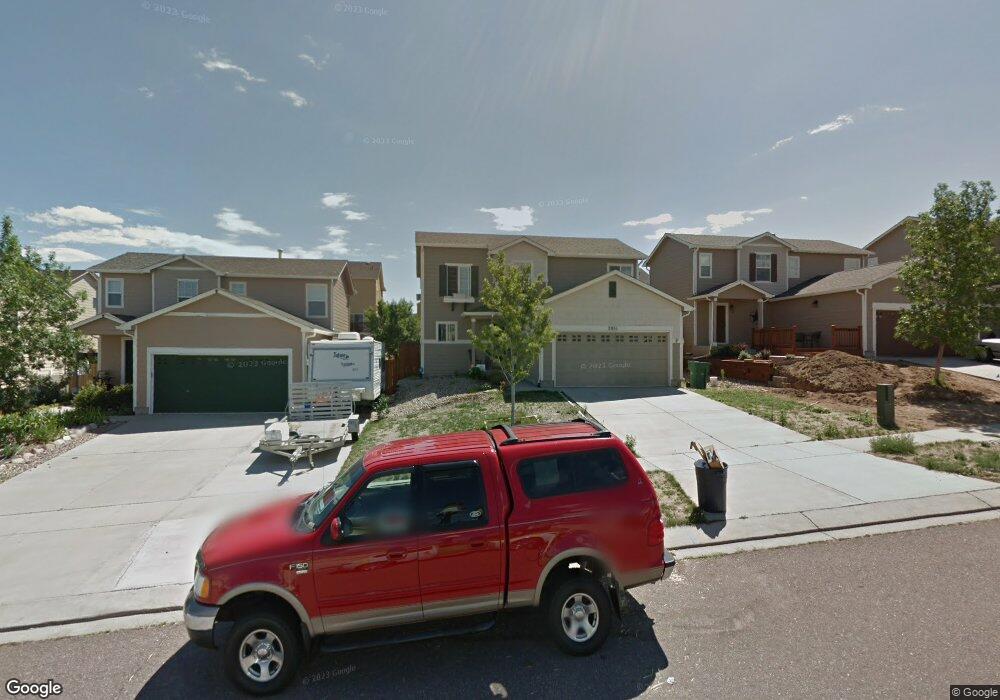
2051 Springside Dr Colorado Springs, CO 80951
Estimated Value: $407,275 - $425,000
4
Beds
3
Baths
1,464
Sq Ft
$283/Sq Ft
Est. Value
About This Home
This home is located at 2051 Springside Dr, Colorado Springs, CO 80951 and is currently estimated at $414,069, approximately $282 per square foot. 2051 Springside Dr is a home located in El Paso County with nearby schools including Evans International Elementary School, Horizon Middle School, and Sand Creek High School.
Ownership History
Date
Name
Owned For
Owner Type
Purchase Details
Closed on
Dec 10, 2004
Sold by
Prudential Residential Services Lp
Bought by
Motley Shaun M and Motley Katy L
Current Estimated Value
Home Financials for this Owner
Home Financials are based on the most recent Mortgage that was taken out on this home.
Original Mortgage
$173,641
Outstanding Balance
$81,941
Interest Rate
4.87%
Mortgage Type
VA
Estimated Equity
$332,128
Purchase Details
Closed on
Apr 22, 2003
Sold by
Ritchie Susanne M
Bought by
Persico Kenneth J and Persico Elise
Home Financials for this Owner
Home Financials are based on the most recent Mortgage that was taken out on this home.
Original Mortgage
$148,000
Interest Rate
8.75%
Mortgage Type
Seller Take Back
Purchase Details
Closed on
Jan 31, 2003
Sold by
Richmond American Homes Of Colorado Inc
Bought by
Ritchie Susanne M
Create a Home Valuation Report for This Property
The Home Valuation Report is an in-depth analysis detailing your home's value as well as a comparison with similar homes in the area
Home Values in the Area
Average Home Value in this Area
Purchase History
| Date | Buyer | Sale Price | Title Company |
|---|---|---|---|
| Motley Shaun M | $169,987 | Land Title | |
| Prudential Residential Services Lp | $169,987 | Land Title | |
| Persico Kenneth J | $159,000 | Stewart Title | |
| Ritchie Susanne M | $147,080 | Stewart Title |
Source: Public Records
Mortgage History
| Date | Status | Borrower | Loan Amount |
|---|---|---|---|
| Open | Motley Shaun M | $173,641 | |
| Previous Owner | Persico Kenneth J | $148,000 |
Source: Public Records
Tax History Compared to Growth
Tax History
| Year | Tax Paid | Tax Assessment Tax Assessment Total Assessment is a certain percentage of the fair market value that is determined by local assessors to be the total taxable value of land and additions on the property. | Land | Improvement |
|---|---|---|---|---|
| 2025 | $1,624 | $26,750 | -- | -- |
| 2024 | $1,521 | $27,080 | $5,290 | $21,790 |
| 2023 | $1,521 | $27,080 | $5,290 | $21,790 |
| 2022 | $1,283 | $18,760 | $4,170 | $14,590 |
| 2021 | $1,335 | $19,300 | $4,290 | $15,010 |
| 2020 | $1,138 | $16,390 | $3,580 | $12,810 |
| 2019 | $1,128 | $16,390 | $3,580 | $12,810 |
| 2018 | $897 | $12,820 | $3,560 | $9,260 |
| 2017 | $821 | $12,820 | $3,560 | $9,260 |
| 2016 | $842 | $12,970 | $3,580 | $9,390 |
| 2015 | $843 | $12,970 | $3,580 | $9,390 |
| 2014 | $794 | $11,990 | $3,580 | $8,410 |
Source: Public Records
Map
Nearby Homes
- 2060 Pinyon Jay Dr
- 2068 Killdeer Ct
- 2265 Sage Grouse Ln
- 2404 Obsidian Forest View
- 8809 Christy Ct
- 2338 Jeanette Way
- 2210 Whale Point
- 2575 Shannara Grove
- 2322 Zebra Point
- 1974 Capital Dr
- 1649 Reilly Grove
- 1768 Reilly Grove
- 8163 Postrock Dr
- 7820 Parsonage Ln
- 2034 Lillian Way
- 1725 Bucolo Ave
- 1925 Dewhirst Dr
- 8042 Parsonage Ln
- 2021 Dewhirst Dr
- 2631 Gobi Dr
- 2041 Springside Dr
- 2061 Springside Dr
- 2072 Pinyon Jay Dr
- 2071 Springside Dr
- 2031 Springside Dr
- 2084 Pinyon Jay Dr
- 2048 Pinyon Jay Dr
- 2096 Pinyon Jay Dr
- 2081 Springside Dr
- 2021 Springside Dr
- 2052 Springside Dr
- 2062 Springside Dr
- 2042 Springside Dr
- 2108 Pinyon Jay Dr
- 2036 Pinyon Jay Dr
- 2072 Springside Dr
- 2032 Springside Dr
- 2091 Springside Dr
- 2011 Springside Dr
- 2082 Springside Dr