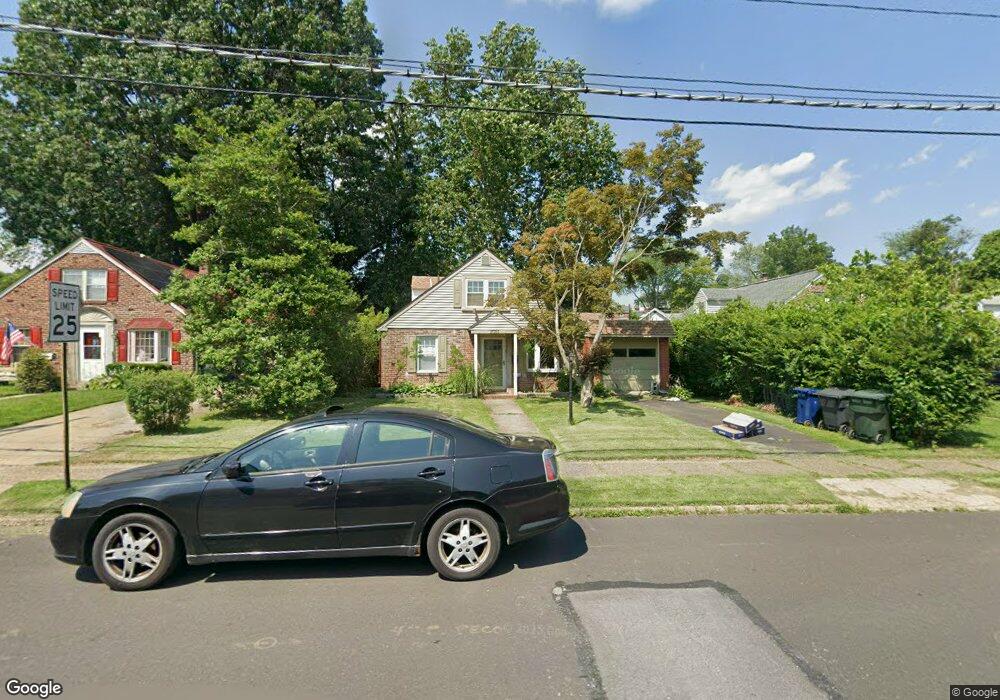
2051 Wharton Rd Glenside, PA 19038
Estimated Value: $393,538 - $454,000
4
Beds
2
Baths
1,408
Sq Ft
$299/Sq Ft
Est. Value
About This Home
This home is located at 2051 Wharton Rd, Glenside, PA 19038 and is currently estimated at $420,385, approximately $298 per square foot. 2051 Wharton Rd is a home located in Montgomery County with nearby schools including Copper Beech Elementary School, Abington Middle School, and Abington Senior High School.
Ownership History
Date
Name
Owned For
Owner Type
Purchase Details
Closed on
Mar 25, 2008
Sold by
Huizenga C Nolan and Huizenga Denise A
Bought by
Durphy Gerald F
Current Estimated Value
Home Financials for this Owner
Home Financials are based on the most recent Mortgage that was taken out on this home.
Original Mortgage
$220,915
Outstanding Balance
$141,710
Interest Rate
6.3%
Estimated Equity
$278,675
Purchase Details
Closed on
Jun 22, 2006
Sold by
Thompson Joseph and Dodge Susan
Bought by
Huizenga C Nolan and Huizenga Denise A
Home Financials for this Owner
Home Financials are based on the most recent Mortgage that was taken out on this home.
Original Mortgage
$254,900
Interest Rate
6.71%
Purchase Details
Closed on
Aug 29, 2003
Sold by
Dinapoli Ralph J
Bought by
Dodge Susan and Thompson Joseph
Purchase Details
Closed on
Jun 23, 1995
Sold by
Barber Christopher K and Barber Earle N
Bought by
Dinapoli Ralph J
Create a Home Valuation Report for This Property
The Home Valuation Report is an in-depth analysis detailing your home's value as well as a comparison with similar homes in the area
Home Values in the Area
Average Home Value in this Area
Purchase History
| Date | Buyer | Sale Price | Title Company |
|---|---|---|---|
| Durphy Gerald F | $259,900 | None Available | |
| Huizenga C Nolan | $259,900 | Landamerica | |
| Dodge Susan | $179,900 | -- | |
| Dinapoli Ralph J | $110,000 | -- |
Source: Public Records
Mortgage History
| Date | Status | Borrower | Loan Amount |
|---|---|---|---|
| Open | Durphy Gerald F | $220,915 | |
| Previous Owner | Huizenga C Nolan | $254,900 |
Source: Public Records
Tax History Compared to Growth
Tax History
| Year | Tax Paid | Tax Assessment Tax Assessment Total Assessment is a certain percentage of the fair market value that is determined by local assessors to be the total taxable value of land and additions on the property. | Land | Improvement |
|---|---|---|---|---|
| 2025 | $4,828 | $104,270 | $40,150 | $64,120 |
| 2024 | $4,828 | $104,270 | $40,150 | $64,120 |
| 2023 | $4,627 | $104,270 | $40,150 | $64,120 |
| 2022 | $4,479 | $104,270 | $40,150 | $64,120 |
| 2021 | $4,238 | $104,270 | $40,150 | $64,120 |
| 2020 | $4,177 | $104,270 | $40,150 | $64,120 |
| 2019 | $4,177 | $104,270 | $40,150 | $64,120 |
| 2018 | $4,178 | $104,270 | $40,150 | $64,120 |
| 2017 | $4,054 | $104,270 | $40,150 | $64,120 |
| 2016 | $4,014 | $104,270 | $40,150 | $64,120 |
| 2015 | $3,892 | $104,270 | $40,150 | $64,120 |
| 2014 | $3,773 | $104,270 | $40,150 | $64,120 |
Source: Public Records
Map
Nearby Homes
- 414 Highland Ave
- 2132 Jenkintown Rd
- 604 Pinetree Rd
- 547 Baeder Rd
- 11 North Ave
- 303 Rodman Ave
- 619 Paxson Ave
- 606 Wanamaker Rd
- 104 Runnymede Ave
- 600 Runnymede Ave
- 123 Waverly Rd
- 229 Parkside Ln
- 231 Roberts Ave
- 100 West Ave Unit 226S
- 100 West Ave Unit 326S
- 100 West Ave Unit 119S
- 100 West Ave Unit 202-S (2B)
- 100 West Ave Unit 407S
- 100 West Ave Unit 604-W
- 100 West Ave Unit 530-S
- 2055 Wharton Rd
- 2047 Wharton Rd
- 2059 Wharton Rd
- 2043 Wharton Rd
- 2056 Parkdale Ave
- 2052 Parkdale Ave
- 2062 Parkdale Ave
- 2048 Parkdale Ave
- 2063 Wharton Rd
- 2066 Parkdale Ave
- 2037 Wharton Rd
- 2050 Wharton Rd
- 2054 Wharton Rd
- 2067 Wharton Rd Unit 11
- 2046 Wharton Rd
- 2070 Parkdale Ave
- 2058 Wharton Rd
- 2071 Wharton Rd
- 2064 Wharton Rd
- 2038 Wharton Rd