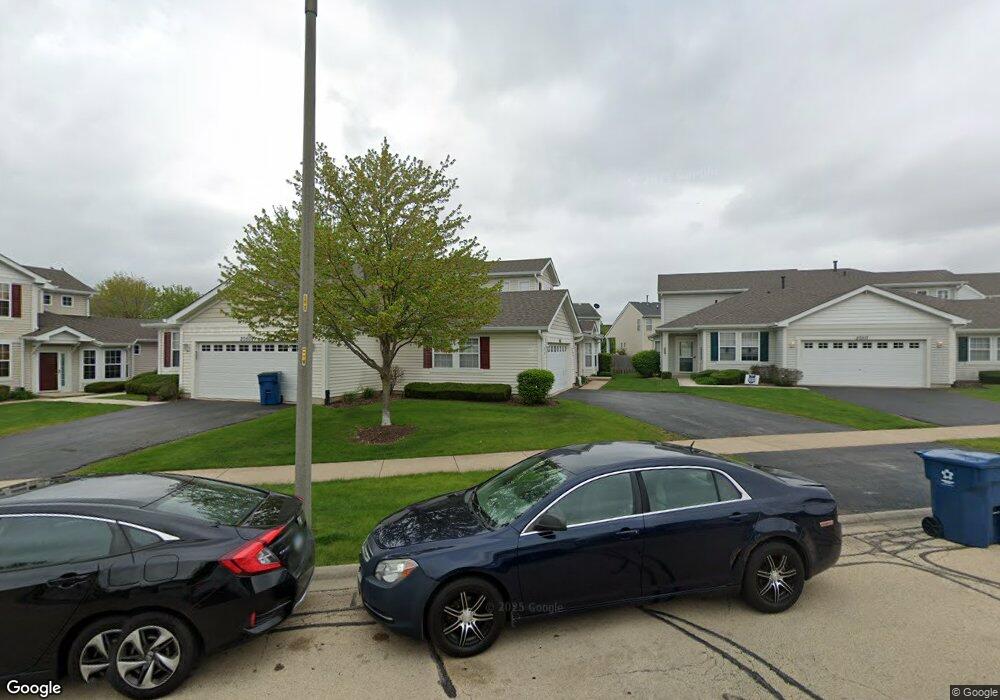
20513 Mcgilvray Dr Crest Hill, IL 60403
Estimated Value: $278,823 - $325,000
2
Beds
3
Baths
1,687
Sq Ft
$178/Sq Ft
Est. Value
About This Home
This home is located at 20513 Mcgilvray Dr, Crest Hill, IL 60403 and is currently estimated at $300,206, approximately $177 per square foot. 20513 Mcgilvray Dr is a home located in Will County with nearby schools including Richland Elementary School, Richland Jr High School, and Lockport Township High School East.
Ownership History
Date
Name
Owned For
Owner Type
Purchase Details
Closed on
Mar 6, 2015
Sold by
American Homes 4 Rent Properties Four Ll
Bought by
Amh 2015-1 Borrower Llc
Current Estimated Value
Purchase Details
Closed on
Nov 4, 2013
Sold by
Sheriff Of Will County Illinois
Bought by
American Homes 4 Rent Properties Four Ll
Purchase Details
Closed on
Feb 27, 2013
Sold by
Mangwiza Moira R
Bought by
American Homes 4 Rent Properties Four Ll
Purchase Details
Closed on
Apr 30, 2007
Sold by
Remington Lakes Llc
Bought by
Mangwiza Moira R
Home Financials for this Owner
Home Financials are based on the most recent Mortgage that was taken out on this home.
Original Mortgage
$213,650
Interest Rate
6.2%
Mortgage Type
Purchase Money Mortgage
Create a Home Valuation Report for This Property
The Home Valuation Report is an in-depth analysis detailing your home's value as well as a comparison with similar homes in the area
Home Values in the Area
Average Home Value in this Area
Purchase History
| Date | Buyer | Sale Price | Title Company |
|---|---|---|---|
| Amh 2015-1 Borrower Llc | -- | None Available | |
| American Homes 4 Rent Properties Four Ll | $115,651 | None Available | |
| American Homes 4 Rent Properties Four Ll | $115,651 | None Available | |
| Mangwiza Moira R | $225,000 | Chicago Title Insurance Co |
Source: Public Records
Mortgage History
| Date | Status | Borrower | Loan Amount |
|---|---|---|---|
| Previous Owner | Mangwiza Moira R | $213,650 |
Source: Public Records
Tax History Compared to Growth
Tax History
| Year | Tax Paid | Tax Assessment Tax Assessment Total Assessment is a certain percentage of the fair market value that is determined by local assessors to be the total taxable value of land and additions on the property. | Land | Improvement |
|---|---|---|---|---|
| 2024 | $6,483 | $80,318 | $18,591 | $61,727 |
| 2023 | $6,483 | $71,005 | $16,690 | $54,315 |
| 2022 | $5,293 | $61,798 | $14,526 | $47,272 |
| 2021 | $5,037 | $58,075 | $13,651 | $44,424 |
| 2020 | $4,914 | $56,165 | $13,202 | $42,963 |
| 2019 | $4,672 | $53,237 | $12,514 | $40,723 |
| 2018 | $4,532 | $50,181 | $11,795 | $38,386 |
| 2017 | $4,311 | $47,372 | $11,135 | $36,237 |
| 2016 | $4,448 | $47,486 | $11,162 | $36,324 |
| 2015 | $3,548 | $44,295 | $10,412 | $33,883 |
| 2014 | $3,548 | $41,397 | $9,731 | $31,666 |
| 2013 | $3,548 | $43,121 | $10,136 | $32,985 |
Source: Public Records
Map
Nearby Homes
- 16107 Huron St Unit 1
- 20711 W Renwick Rd
- 625 Edward Dr Unit 7C
- 16415 Grandwood Lake Dr
- 16400 Grandwood Lake Dr
- 16163 Seneca Lake Cir
- 21201 Lily Lake Ln
- 733 S Mecosta Ln Unit 2
- 715 S Wellston Ln
- 21308 Brush Lake Dr
- 16613 Buckner Pond Way
- 21316 Brush Lake Dr
- 746 S Mecosta Ln
- 1532 W Cadillac Cir
- 1508 Ludington
- 1592 Cadillac Cir
- 16012 Carillon Lakes Ct
- 1517 W Ludington Cir Unit 3
- 17104 Weber Rd
- 16400 Crescent Lake Dr
- 20513 Mcgilvray Dr
- 20513 Mcgilvray Dr Unit 88-2
- 20509 Mcgilvray Dr
- 20517 Mcgilvray Dr
- 20521 Mcgilvray Dr
- 20521 Mcgilvray Dr Unit 89-2
- 20505 Mcgilvray Dr
- 20508 Erie Ct Unit 2
- 20512 Erie Ct Unit 2
- 20501 Mcgilvray Dr
- 20501 Mcgilvray Dr
- 20504 Erie Ct
- 20525 Mcgilvray Dr
- 20516 Erie Ct Unit 2
- 20500 Erie Ct Unit 2
- 20529 Mcgilvray Dr
- 20520 Erie Ct
- 20512 Mcgilvray Dr
- 20508 Mcgilvray Dr
- 20516 Mcgilvray Dr