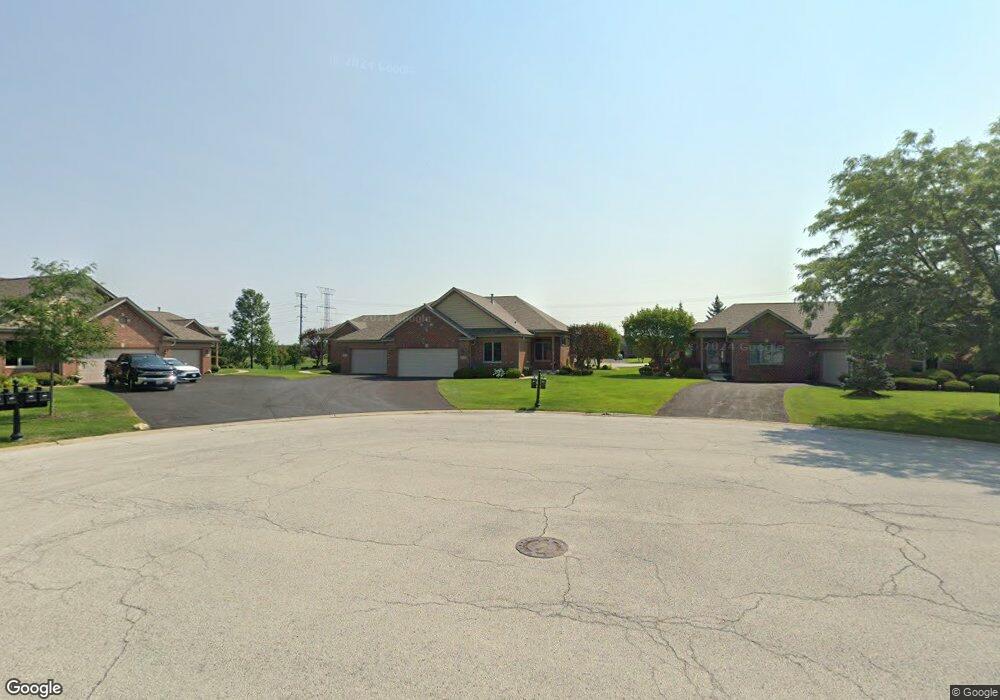
20516 Torrey Ct Frankfort, IL 60423
North Frankfort NeighborhoodEstimated Value: $405,805 - $573,000
2
Beds
2
Baths
1,768
Sq Ft
$257/Sq Ft
Est. Value
About This Home
This home is located at 20516 Torrey Ct, Frankfort, IL 60423 and is currently estimated at $453,701, approximately $256 per square foot. 20516 Torrey Ct is a home located in Will County with nearby schools including Indian Trail Elementary School, Summit Hill Junior High School, and Lincoln-Way East High School.
Ownership History
Date
Name
Owned For
Owner Type
Purchase Details
Closed on
Mar 31, 2017
Sold by
Pagoria Sam J and Pagoria Angeline S
Bought by
Hellman William C and Hellman Martha J
Current Estimated Value
Home Financials for this Owner
Home Financials are based on the most recent Mortgage that was taken out on this home.
Original Mortgage
$255,000
Outstanding Balance
$212,430
Interest Rate
4.25%
Mortgage Type
New Conventional
Estimated Equity
$241,271
Purchase Details
Closed on
Dec 13, 2002
Sold by
Carlson Homes Inc
Bought by
Pagoria Sam J and Pagoria Angeline S
Home Financials for this Owner
Home Financials are based on the most recent Mortgage that was taken out on this home.
Original Mortgage
$114,000
Interest Rate
6.13%
Mortgage Type
Purchase Money Mortgage
Purchase Details
Closed on
Jul 25, 2002
Sold by
Colony Hill Inc
Bought by
Carlson Homes Inc
Home Financials for this Owner
Home Financials are based on the most recent Mortgage that was taken out on this home.
Original Mortgage
$370,400
Interest Rate
4.75%
Mortgage Type
Construction
Create a Home Valuation Report for This Property
The Home Valuation Report is an in-depth analysis detailing your home's value as well as a comparison with similar homes in the area
Home Values in the Area
Average Home Value in this Area
Purchase History
| Date | Buyer | Sale Price | Title Company |
|---|---|---|---|
| Hellman William C | $300,000 | Baird & Warner Title Svcs In | |
| Pagoria Sam J | $233,500 | Chicago Title Insurance Co | |
| Carlson Homes Inc | $91,000 | Chicago Title Insurance Co |
Source: Public Records
Mortgage History
| Date | Status | Borrower | Loan Amount |
|---|---|---|---|
| Open | Hellman William C | $255,000 | |
| Previous Owner | Pagoria Sam J | $114,000 | |
| Previous Owner | Carlson Homes Inc | $370,400 |
Source: Public Records
Tax History Compared to Growth
Tax History
| Year | Tax Paid | Tax Assessment Tax Assessment Total Assessment is a certain percentage of the fair market value that is determined by local assessors to be the total taxable value of land and additions on the property. | Land | Improvement |
|---|---|---|---|---|
| 2024 | $9,029 | $119,390 | $780 | $118,610 |
| 2023 | $9,029 | $106,627 | $697 | $105,930 |
| 2022 | $8,144 | $97,119 | $635 | $96,484 |
| 2021 | $7,605 | $90,859 | $594 | $90,265 |
| 2020 | $7,952 | $88,298 | $577 | $87,721 |
| 2019 | $7,205 | $85,935 | $562 | $85,373 |
| 2018 | $6,825 | $82,411 | $546 | $81,865 |
| 2017 | $6,667 | $80,487 | $533 | $79,954 |
| 2016 | $6,439 | $77,728 | $515 | $77,213 |
| 2015 | $6,180 | $74,991 | $497 | $74,494 |
| 2014 | $6,180 | $74,470 | $494 | $73,976 |
| 2013 | $6,180 | $81,847 | $1,986 | $79,861 |
Source: Public Records
Map
Nearby Homes
- 20530 Torrey Ct
- 8679 Cullen Dr
- 20328 Taliesin Way
- 20408 Fallingwater Cir
- 8310 Auburn Ln
- 8510 W Saint Francis Rd
- 8250 Auburn Ln
- 20375 Grosse Point Dr Unit 102
- 20399 Grosse Point Dr Unit 123
- 20373 Mackinac Point Dr Unit 62
- 20301 S Pine Hill Rd Unit 1D
- 8855 Milwaukee Breakwater Dr
- 20665 Grand Haven Dr
- 24455 S 88th Ave
- 20158 S Rosewood Dr
- 20644 Grand Haven Dr
- 8884 Port Washington Dr
- 9004 Port Washington Dr
- 8964 Port Washington Dr
- 8638 Saddlebred Ct Unit 24
- 20528 Torrey Ct
- 20514 Torrey Ct
- 20510 Torrey Ct
- 20508 Torrey Ct
- 20527 Lennon Ct
- 20541 Lennon Ct
- 20525 Lennon Ct
- 20503 Torrey Ct
- 20543 Lennon Ct
- 20513 Lennon Ct
- 20527 Torrey Ct
- 20515 Torrey Ct
- 20505 Torrey Ct
- 20513 Torrey Ct
- 20529 Torrey Ct
- 20529 Torrey Ct Unit 1
- 20511 Lennon Ct
- 8518 Huckins Dr
- 8534 Huckins Dr
- 20555 Lennon Dr