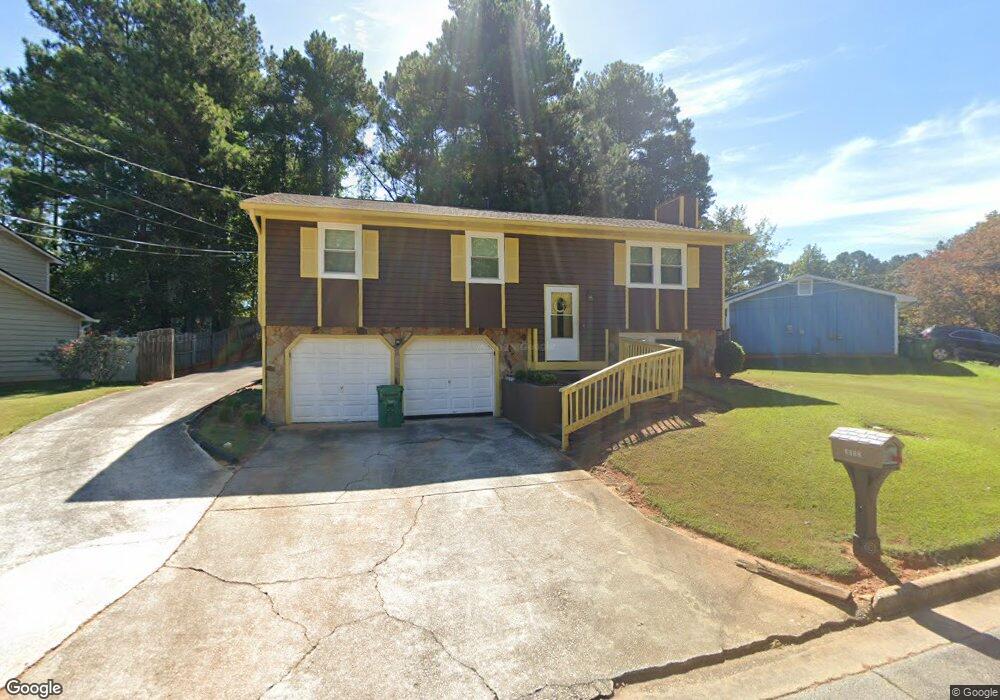
2052 Mallard Crest Lithonia, GA 30058
Estimated Value: $206,842 - $221,000
Studio
1
Bath
1,649
Sq Ft
$129/Sq Ft
Est. Value
About This Home
This home is located at 2052 Mallard Crest, Lithonia, GA 30058 and is currently estimated at $212,711, approximately $128 per square foot. 2052 Mallard Crest is a home located in DeKalb County with nearby schools including Panola Way Elementary School, Miller Grove Middle School, and Miller Grove High School.
Ownership History
Date
Name
Owned For
Owner Type
Purchase Details
Closed on
Sep 19, 2008
Sold by
Morice Kevin M
Bought by
Prayor Beverly D
Current Estimated Value
Home Financials for this Owner
Home Financials are based on the most recent Mortgage that was taken out on this home.
Original Mortgage
$85,115
Outstanding Balance
$56,532
Interest Rate
6.49%
Mortgage Type
FHA
Estimated Equity
$156,179
Purchase Details
Closed on
Jun 5, 2007
Sold by
Suntrust Mortgage Inc
Bought by
Hud-Housing Of Urban Dev
Purchase Details
Closed on
Apr 29, 2005
Sold by
Wilson Sandra
Bought by
Turner Marylin
Home Financials for this Owner
Home Financials are based on the most recent Mortgage that was taken out on this home.
Original Mortgage
$128,650
Interest Rate
5.99%
Mortgage Type
VA
Purchase Details
Closed on
Nov 17, 1995
Sold by
Malcom Melinda I
Bought by
Wilson Sandra
Create a Home Valuation Report for This Property
The Home Valuation Report is an in-depth analysis detailing your home's value as well as a comparison with similar homes in the area
Home Values in the Area
Average Home Value in this Area
Purchase History
We collect this data history from publicly available records. To have your information removed, we recommend requesting removal directly through your county’s website.
| Date | Buyer | Sale Price | Title Company |
|---|---|---|---|
| Prayor Beverly D | $86,000 | -- | |
| Hud-Housing Of Urban Dev | -- | -- | |
| Suntrust Mortgage Inc | $132,391 | -- | |
| Turner Marylin | $123,700 | -- | |
| Wilson Sandra | $11,500 | -- |
Source: Public Records
Mortgage History
We collect this data history from publicly available records. To have your information removed, we recommend requesting removal directly through your county’s website.
| Date | Status | Borrower | Loan Amount |
|---|---|---|---|
| Open | Prayor Beverly D | $85,115 | |
| Previous Owner | Turner Marylin | $128,650 | |
| Closed | Wilson Sandra | $0 |
Source: Public Records
Tax History
| Year | Tax Paid | Tax Assessment Tax Assessment Total Assessment is a certain percentage of the fair market value that is determined by local assessors to be the total taxable value of land and additions on the property. | Land | Improvement |
|---|---|---|---|---|
| 2025 | $788 | $88,040 | $16,000 | $72,040 |
| 2024 | $831 | $90,760 | $16,000 | $74,760 |
| 2023 | $831 | $89,160 | $16,000 | $73,160 |
| 2022 | $739 | $76,720 | $8,000 | $68,720 |
| 2021 | $709 | $45,200 | $4,200 | $41,000 |
| 2020 | $650 | $39,960 | $4,200 | $35,760 |
| 2019 | $650 | $41,000 | $4,200 | $36,800 |
| 2018 | $998 | $39,840 | $4,200 | $35,640 |
| 2017 | $836 | $25,000 | $4,200 | $20,800 |
| 2016 | $934 | $28,360 | $4,200 | $24,160 |
| 2014 | $655 | $20,080 | $4,200 | $15,880 |
Source: Public Records
Map
Nearby Homes
- 5570 Downs Way
- 2469 Briar Knoll Rd
- 2420 Briar Knoll Rd
- 2034 Mallard Way
- 2123 Panola Rd
- 5586 Cannonade Ln
- 5570 Cannonade Ln
- 5456 Forest Pines Dr
- 2005 Downs Place
- 5595 Marbut Rd
- 2169 Panola Rd
- 2206 Justify Ln
- 5676 Marbut Rd
- 5687 Wellborn Oaks Ct
- 5427 Forest Pines Dr
- 5578 Wellborn Creek Dr Unit 2
- 5401 Panola Way Ln
- 5490 Marbut Rd
- 2242 Justify Ln
- 5358 Brooklands Dr
- 2044 Mallard Crest
- 2062 Mallard Crest
- 2038 Mallard Crest
- 2068 Mallard Crest
- 2053 Mallard Crescent
- 2049 Mallard Crescent
- 2057 Mallard Crescent Unit I
- 2067 Drake Ct
- 2063 Drake Ct
- 2032 Mallard Crest
- 2074 Mallard Crest
- 2065 Mallard Crescent
- 2045 Mallard Crest
- 2041 Mallard Crest
- 2035 Mallard Crest
- 5556 Mallard Trail
- 2028 Mallard Crest Unit 1
- 5562 Mallard Trail
- 2082 Mallard Crest
- 2061 Mallard Crest
Your Personal Tour Guide
Ask me questions while you tour the home.