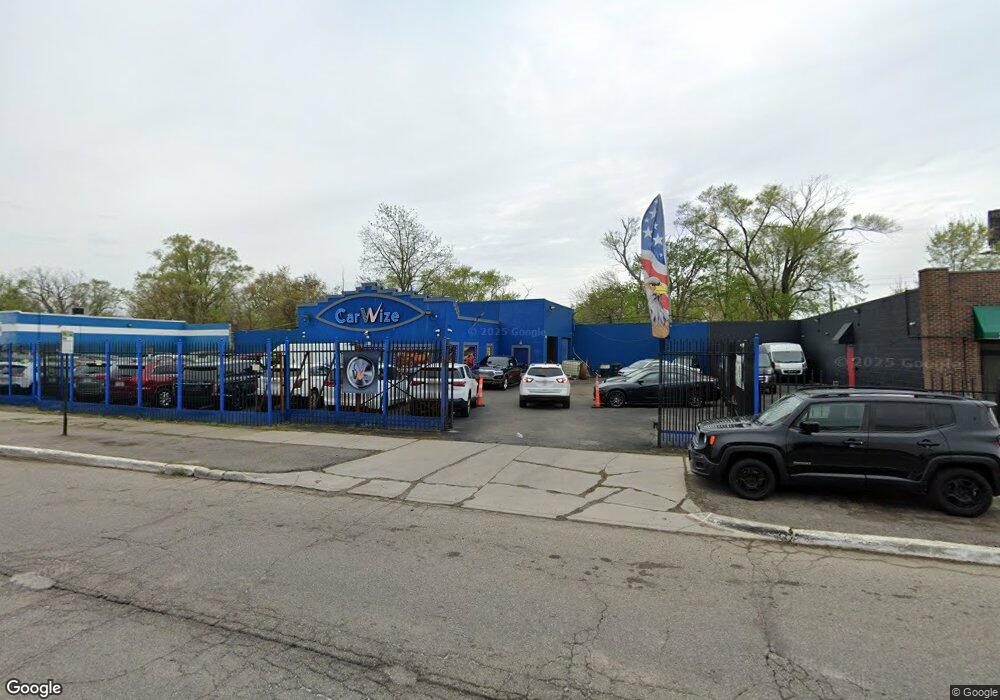
20525 John R St Highland Park, MI 48203
Nolan NeighborhoodEstimated Value: $542,837
--
Bed
--
Bath
1,200
Sq Ft
$452/Sq Ft
Est. Value
About This Home
This home is located at 20525 John R St, Highland Park, MI 48203 and is currently priced at $542,837, approximately $452 per square foot. 20525 John R St is a home located in Wayne County with nearby schools including Nolan Elementary/Middle School, Charles L. Spain Elementary-Middle School, and Edward 'Duke' Ellington Conservatory of Music and Art.
Ownership History
Date
Name
Owned For
Owner Type
Purchase Details
Closed on
Nov 29, 2022
Sold by
Ogeen Property Llc
Bought by
Zain Properties And Management Llc
Current Estimated Value
Purchase Details
Closed on
Sep 11, 2019
Sold by
Kada Ogeen
Bought by
Ogeen Property Llc
Home Financials for this Owner
Home Financials are based on the most recent Mortgage that was taken out on this home.
Original Mortgage
$300,000
Interest Rate
3.6%
Mortgage Type
Credit Line Revolving
Purchase Details
Closed on
Jul 3, 2019
Sold by
Fandakly Waeil
Bought by
Kada Ogeen
Purchase Details
Closed on
Jul 14, 2016
Sold by
Fandakly Waeil
Bought by
Kada Ogeen
Home Financials for this Owner
Home Financials are based on the most recent Mortgage that was taken out on this home.
Original Mortgage
$200,000
Interest Rate
8%
Mortgage Type
Seller Take Back
Create a Home Valuation Report for This Property
The Home Valuation Report is an in-depth analysis detailing your home's value as well as a comparison with similar homes in the area
Home Values in the Area
Average Home Value in this Area
Purchase History
| Date | Buyer | Sale Price | Title Company |
|---|---|---|---|
| Zain Properties And Management Llc | $450,000 | -- | |
| Ogeen Property Llc | -- | None Available | |
| Kada Ogeen | $200,000 | Title Agency Inc | |
| Kada Ogeen | $200,000 | Philip F Greco Title Company |
Source: Public Records
Mortgage History
| Date | Status | Borrower | Loan Amount |
|---|---|---|---|
| Previous Owner | Ogeen Property Llc | $300,000 | |
| Previous Owner | Kada Ogeen | $200,000 |
Source: Public Records
Tax History Compared to Growth
Tax History
| Year | Tax Paid | Tax Assessment Tax Assessment Total Assessment is a certain percentage of the fair market value that is determined by local assessors to be the total taxable value of land and additions on the property. | Land | Improvement |
|---|---|---|---|---|
| 2025 | $8,365 | $115,600 | $0 | $0 |
| 2024 | $8,365 | $106,600 | $0 | $0 |
| 2023 | $8,056 | $98,800 | $0 | $0 |
| 2022 | $7,207 | $87,800 | $0 | $0 |
| 2021 | $4,762 | $75,600 | $0 | $0 |
| 2020 | $4,311 | $73,800 | $0 | $0 |
| 2019 | $4,232 | $74,000 | $0 | $0 |
| 2018 | $3,611 | $45,600 | $0 | $0 |
| 2017 | $2,292 | $120,800 | $0 | $0 |
| 2016 | $8,822 | $170,300 | $0 | $0 |
| 2015 | $9,775 | $119,000 | $0 | $0 |
| 2013 | $9,469 | $118,979 | $0 | $0 |
Source: Public Records
Map
Nearby Homes
- 20515 Coventry St
- 20529 Coventry St
- 0000 E Muir Ave
- 41 W George Ave
- 32 E George Ave
- 000 W Muir Ave
- 20322 Charleston St
- 426 Alameda St
- 20529 Irvington St
- 305 W Hayes Ave
- 20739 Caledonia Ave
- 338 W Hayes Ave
- 0000 W Milton Ave
- 20165 Irvington St
- 166 W Milton Ave
- 601 Alameda St
- 382 W Hayes Ave
- 606 E Milton Ave
- 508 E Bernhard Ave
- 20004 Coventry St
- 20525 W John R St
- 20518 Derby St
- 20510 Derby St
- 20504 Derby St
- 20496 Derby St
- 20524 Derby St
- 20536 Derby St
- 20528 Derby St
- 20491 John R St
- 20478 Derby St
- 0 John R Rd Unit 4916859
- 0 John R Rd Unit 4906373
- 0 John R Rd Unit 5459252
- 0 John R Rd Unit 5628012
- 0 John R Rd
- 20537 Coventry St
- 20511 Derby St
- 20505 Derby St
- 20458 Derby St
- 20499 Derby St