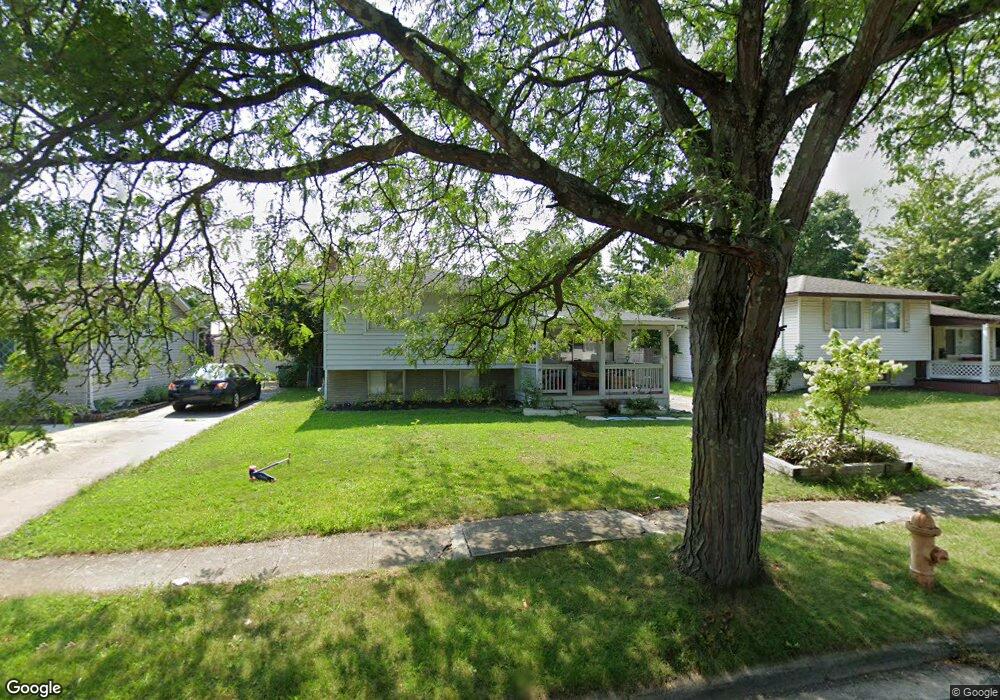
2053 Brookfield Rd Columbus, OH 43229
Forest Park East NeighborhoodEstimated Value: $228,737 - $266,000
3
Beds
2
Baths
1,444
Sq Ft
$172/Sq Ft
Est. Value
About This Home
This home is located at 2053 Brookfield Rd, Columbus, OH 43229 and is currently estimated at $247,684, approximately $171 per square foot. 2053 Brookfield Rd is a home located in Franklin County with nearby schools including Forest Park Elementary School, Woodward Park Middle School, and Northland High School.
Ownership History
Date
Name
Owned For
Owner Type
Purchase Details
Closed on
Mar 20, 2009
Sold by
Federal Home Loan Mortgage Corporation
Bought by
Smith Jeffrey A
Current Estimated Value
Purchase Details
Closed on
Oct 8, 2008
Sold by
Harding Robert W and Fifth Third Mortgage Co
Bought by
Federal Home Loan Mortgage Corporation
Purchase Details
Closed on
Jun 30, 2004
Sold by
Kienzel David and Kienzel Rebecca L
Bought by
Harding Robert W
Home Financials for this Owner
Home Financials are based on the most recent Mortgage that was taken out on this home.
Original Mortgage
$125,900
Interest Rate
5.25%
Mortgage Type
Purchase Money Mortgage
Purchase Details
Closed on
Aug 30, 2001
Sold by
Disterdick George S and Disterdick Marcella L
Bought by
Kienzel David and Kienzel Rebecca L
Purchase Details
Closed on
Feb 26, 1968
Bought by
Disterdick George S
Create a Home Valuation Report for This Property
The Home Valuation Report is an in-depth analysis detailing your home's value as well as a comparison with similar homes in the area
Home Values in the Area
Average Home Value in this Area
Purchase History
| Date | Buyer | Sale Price | Title Company |
|---|---|---|---|
| Smith Jeffrey A | $52,000 | Attorney | |
| Federal Home Loan Mortgage Corporation | $82,000 | None Available | |
| Harding Robert W | $125,900 | Esquire Tit | |
| Kienzel David | $110,900 | Lawyers Title | |
| Disterdick George S | -- | -- |
Source: Public Records
Mortgage History
| Date | Status | Borrower | Loan Amount |
|---|---|---|---|
| Previous Owner | Harding Robert W | $125,900 |
Source: Public Records
Tax History Compared to Growth
Tax History
| Year | Tax Paid | Tax Assessment Tax Assessment Total Assessment is a certain percentage of the fair market value that is determined by local assessors to be the total taxable value of land and additions on the property. | Land | Improvement |
|---|---|---|---|---|
| 2024 | $2,604 | $56,810 | $16,630 | $40,180 |
| 2023 | $2,571 | $56,805 | $16,625 | $40,180 |
| 2022 | $1,582 | $29,760 | $10,610 | $19,150 |
| 2021 | $1,584 | $29,760 | $10,610 | $19,150 |
| 2020 | $1,891 | $35,460 | $10,610 | $24,850 |
| 2019 | $1,632 | $26,250 | $7,840 | $18,410 |
| 2018 | $1,378 | $26,250 | $7,840 | $18,410 |
| 2017 | $1,434 | $26,250 | $7,840 | $18,410 |
| 2016 | $1,236 | $18,200 | $7,770 | $10,430 |
| 2015 | $1,126 | $18,200 | $7,770 | $10,430 |
| 2014 | $1,128 | $18,200 | $7,770 | $10,430 |
| 2013 | $920 | $30,100 | $7,770 | $22,330 |
Source: Public Records
Map
Nearby Homes
- 2084 Brookfield Rd
- 1914 Walden Dr
- 5726 Beechcroft Rd Unit J
- 1881 Brimfield Rd
- 5732 Beechcroft Rd Unit B
- 5522 Parkshire Dr Unit 5522
- 5556 Parkshire Dr Unit 5556
- 5578 Parkshire Dr Unit 5578
- 2294 Teakwood Dr
- 5485 Tamarack Blvd
- 5204 Honeytree Loop W
- 1722 Blue Ash Place
- 1752 Pine Tree St S Unit H
- 1743 Pine Tree St N Unit A
- 1687 Brookfield Square S
- 2250 Webster Canyon Ct
- 2058 Northcliff Dr
- 5056 Northtowne Blvd Unit 5054
- 5124 Northcliff Loop W
- 6019 Beechcroft Rd
- 2061 Brookfield Rd
- 2069 Brookfield Rd
- 2039 Brookfield Rd
- 2054 Sumac Dr
- 2046 Sumac Dr
- 2064 Sumac Dr
- 2031 Brookfield Rd
- 2038 Sumac Dr
- 2056 Brookfield Rd
- 2048 Brookfield Rd
- 2077 Brookfield Rd
- 2062 Brookfield Rd
- 5535 Maple Canyon Ave
- 2040 Brookfield Rd
- 2070 Brookfield Rd
- 2028 Sumac Dr
- 2023 Brookfield Rd
- 2034 Brookfield Rd
- 2076 Brookfield Rd
- 5523 Maple Canyon Ave