Estimated Value: $233,000 - $314,000
3
Beds
1
Bath
1,804
Sq Ft
$154/Sq Ft
Est. Value
About This Home
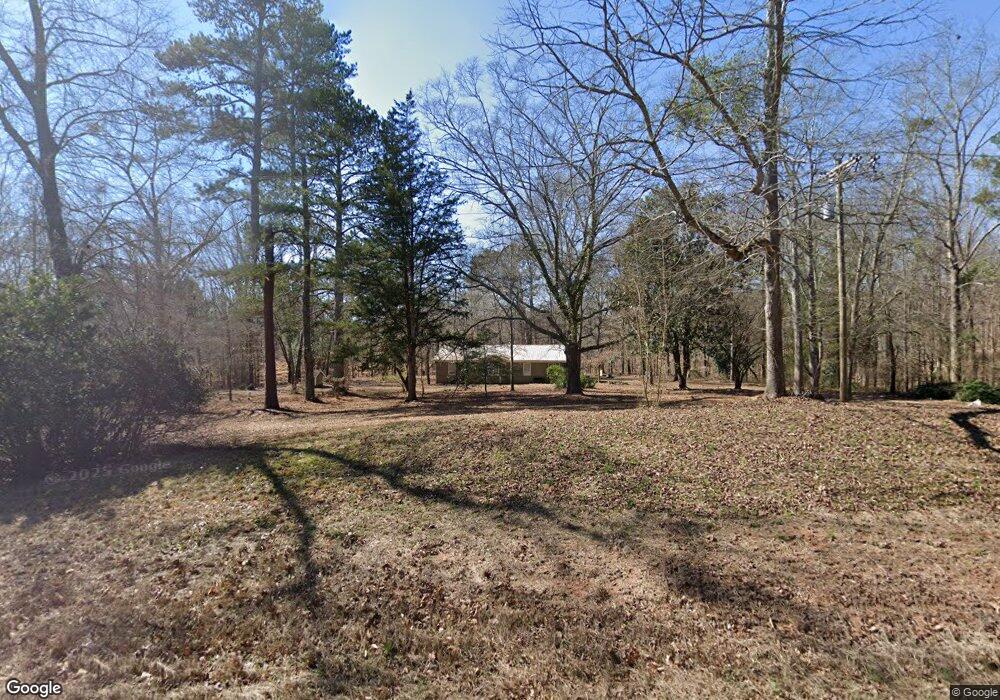
This home is located at 2053 Comer Rd, Comer, GA 30629 and is currently estimated at $277,721, approximately $153 per square foot. 2053 Comer Rd is a home located in Oglethorpe County with nearby schools including Oglethorpe County Primary School, Oglethorpe County Elementary School, and Oglethorpe County Middle School.
Ownership History
Date
Name
Owned For
Owner Type
Purchase Details
Closed on
Oct 29, 2023
Sold by
Brooks Ethan Mitchell
Bought by
Brooks Kristen Allen
Current Estimated Value
Purchase Details
Closed on
Nov 22, 2019
Sold by
Rac Properties Of Athens Inc
Bought by
Brooks Kristen Allen and Brooks Ethan Mitchell
Home Financials for this Owner
Home Financials are based on the most recent Mortgage that was taken out on this home.
Original Mortgage
$129,990
Interest Rate
3.75%
Mortgage Type
New Conventional
Purchase Details
Closed on
Sep 6, 2019
Sold by
Morrison Adrian
Bought by
Rac Properties Of Athens Inc
Purchase Details
Closed on
Apr 11, 2016
Sold by
Doster Charles B
Bought by
Morrison Adrian
Home Financials for this Owner
Home Financials are based on the most recent Mortgage that was taken out on this home.
Original Mortgage
$77,120
Interest Rate
3.68%
Mortgage Type
New Conventional
Purchase Details
Closed on
Aug 4, 2015
Sold by
Brewer Betty S
Bought by
Doster Charles B
Create a Home Valuation Report for This Property
The Home Valuation Report is an in-depth analysis detailing your home's value as well as a comparison with similar homes in the area
Purchase History
| Date | Buyer | Sale Price | Title Company |
|---|---|---|---|
| Brooks Kristen Allen | -- | -- | |
| Brooks Kristen Allen | $129,990 | -- | |
| Rac Properties Of Athens Inc | $89,000 | -- | |
| Morrison Adrian | $75,000 | -- | |
| Doster Charles B | -- | -- |
Source: Public Records
Mortgage History
| Date | Status | Borrower | Loan Amount |
|---|---|---|---|
| Previous Owner | Brooks Kristen Allen | $129,990 | |
| Previous Owner | Morrison Adrian | $77,120 |
Source: Public Records
Tax History
| Year | Tax Paid | Tax Assessment Tax Assessment Total Assessment is a certain percentage of the fair market value that is determined by local assessors to be the total taxable value of land and additions on the property. | Land | Improvement |
|---|---|---|---|---|
| 2025 | $1,841 | $79,784 | $11,560 | $68,224 |
| 2024 | $1,736 | $74,624 | $8,760 | $65,864 |
| 2023 | $1,866 | $74,624 | $8,760 | $65,864 |
| 2022 | $1,522 | $61,192 | $8,760 | $52,432 |
| 2021 | $1,290 | $46,912 | $7,960 | $38,952 |
| 2020 | $1,023 | $46,912 | $7,960 | $38,952 |
| 2019 | $1,301 | $46,912 | $7,960 | $38,952 |
| 2018 | $1,098 | $36,367 | $3,999 | $32,368 |
| 2017 | $851 | $36,367 | $3,999 | $32,368 |
| 2016 | $1,074 | $36,367 | $3,999 | $32,368 |
| 2015 | -- | $32,719 | $3,999 | $28,720 |
| 2014 | -- | $32,719 | $3,999 | $28,720 |
| 2013 | -- | $33,229 | $3,998 | $29,230 |
Source: Public Records
Map
Nearby Homes
- 54 Dove Power Rd
- 109 Mill Run
- 3807 Smithonia Rd
- 315 Clouds Creek Rd
- 1360 Hill St
- 0 Clairmont Ave Unit 10700774
- 113 Sidetrack Cir
- 12 Black Thorn Rd
- 540 Sunset Ave
- 1104 Farm Rd
- 2987 Georgia 72
- 79 Gholston St
- 3614 Georgia 72
- 12 Laurel Ave
- 549 Gholston St
- 640 Gholston St
- 2633 Paoli St Unit TRACT 1
- 2665 Paoli St Unit TRACT 3
- 88 S Railroad Ave
- 130 Shannons Place
Your Personal Tour Guide
Ask me questions while you tour the home.