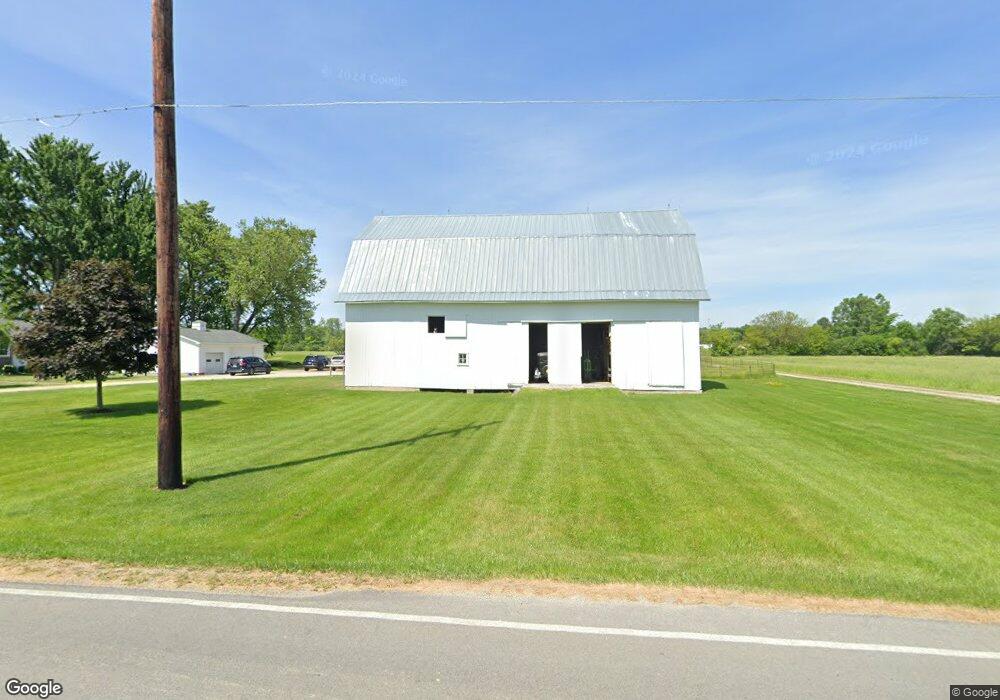
20531 Lemoyne Rd Luckey, OH 43443
Estimated Value: $311,624 - $338,000
3
Beds
2
Baths
2,348
Sq Ft
$137/Sq Ft
Est. Value
About This Home
This home is located at 20531 Lemoyne Rd, Luckey, OH 43443 and is currently estimated at $320,541, approximately $136 per square foot. 20531 Lemoyne Rd is a home located in Wood County with nearby schools including Eastwood Middle School and Eastwood High School.
Ownership History
Date
Name
Owned For
Owner Type
Purchase Details
Closed on
Nov 3, 2020
Sold by
Keeler Lori A and Hess Alexander N
Bought by
Keller Lori A and Hess Alexander N
Current Estimated Value
Home Financials for this Owner
Home Financials are based on the most recent Mortgage that was taken out on this home.
Original Mortgage
$150,000
Outstanding Balance
$118,349
Interest Rate
2.8%
Mortgage Type
New Conventional
Estimated Equity
$202,192
Purchase Details
Closed on
Aug 2, 2007
Sold by
Hoelter Thomas G and Hoelter Kristie
Bought by
Keeler Lori A
Home Financials for this Owner
Home Financials are based on the most recent Mortgage that was taken out on this home.
Original Mortgage
$148,000
Interest Rate
6.69%
Mortgage Type
Purchase Money Mortgage
Purchase Details
Closed on
Apr 28, 2006
Sold by
Marsh Michael J
Bought by
Hoelter Thomas G
Create a Home Valuation Report for This Property
The Home Valuation Report is an in-depth analysis detailing your home's value as well as a comparison with similar homes in the area
Purchase History
| Date | Buyer | Sale Price | Title Company |
|---|---|---|---|
| Keller Lori A | -- | Avenue 365 Lender Svcs Llc | |
| Keeler Lori A | $185,000 | Attorney | |
| Hoelter Thomas G | -- | Marsh & Marsh |
Source: Public Records
Mortgage History
| Date | Status | Borrower | Loan Amount |
|---|---|---|---|
| Open | Keller Lori A | $150,000 | |
| Closed | Keeler Lori A | $148,000 |
Source: Public Records
Tax History
| Year | Tax Paid | Tax Assessment Tax Assessment Total Assessment is a certain percentage of the fair market value that is determined by local assessors to be the total taxable value of land and additions on the property. | Land | Improvement |
|---|---|---|---|---|
| 2025 | $3,329 | $78,890 | $29,190 | $49,700 |
| 2024 | $3,310 | $78,890 | $29,190 | $49,700 |
| 2023 | $3,310 | $78,890 | $29,190 | $49,700 |
| 2022 | $3,053 | $63,980 | $23,170 | $40,810 |
| 2021 | $3,039 | $63,980 | $23,170 | $40,810 |
| 2020 | $3,123 | $63,980 | $23,170 | $40,810 |
| 2019 | $2,843 | $55,060 | $21,880 | $33,180 |
| 2018 | $2,853 | $55,060 | $21,880 | $33,180 |
| 2017 | $2,752 | $55,060 | $21,880 | $33,180 |
| 2016 | $2,478 | $49,600 | $21,000 | $28,600 |
| 2015 | $2,478 | $49,600 | $21,000 | $28,600 |
| 2014 | $2,744 | $49,600 | $21,000 | $28,600 |
| 2013 | $2,898 | $49,600 | $21,000 | $28,600 |
Source: Public Records
Map
Nearby Homes
- 343 Hoelter Ave
- 0 Lemoyne Rd Unit 10003312
- 0 Pemberville Rd
- 420 Linden Dr
- 424 Linden Dr
- 423 Linden Dr
- 449 Linden Dr
- 425 Linden Dr
- 426 Linden Dr
- 421 Linden Dr
- 451 Linden Dr
- 447 Linden Dr
- 459 Linden Dr
- 427 Linden Dr
- 443 W College Ave Unit 443
- 432 Linden St
- 214 Main St
- 428 Linden Drive (Lot 9)
- 123 Catalpa (Lot 21) Ct
- 127 Bierley Ave
- 20635 Lemoyne Rd
- 20508 Lemoyne Rd
- 20606 Lemoyne Rd
- 20661 Lemoyne Rd
- 20465 Lemoyne Rd
- 20681 Lemoyne Rd
- 20672 Lemoyne Rd
- 20482 Lemoyne Rd
- 20691 Lemoyne Rd
- 20426 Lemoyne Rd
- 20417 Lemoyne Rd
- 20662 Lemoyne Rd
- 543 Krotzer Ave Unit 2
- 547 Krotzer Ave Unit 3
- 20757 Lemoyne Rd
- 545 Krotzer Ave Unit 1
- 20396 Lemoyne Rd
- 549 Krotzer Ave Unit 4
- 539 Krotzer Ave
- 535 Krotzer Ave
Your Personal Tour Guide
Ask me questions while you tour the home.