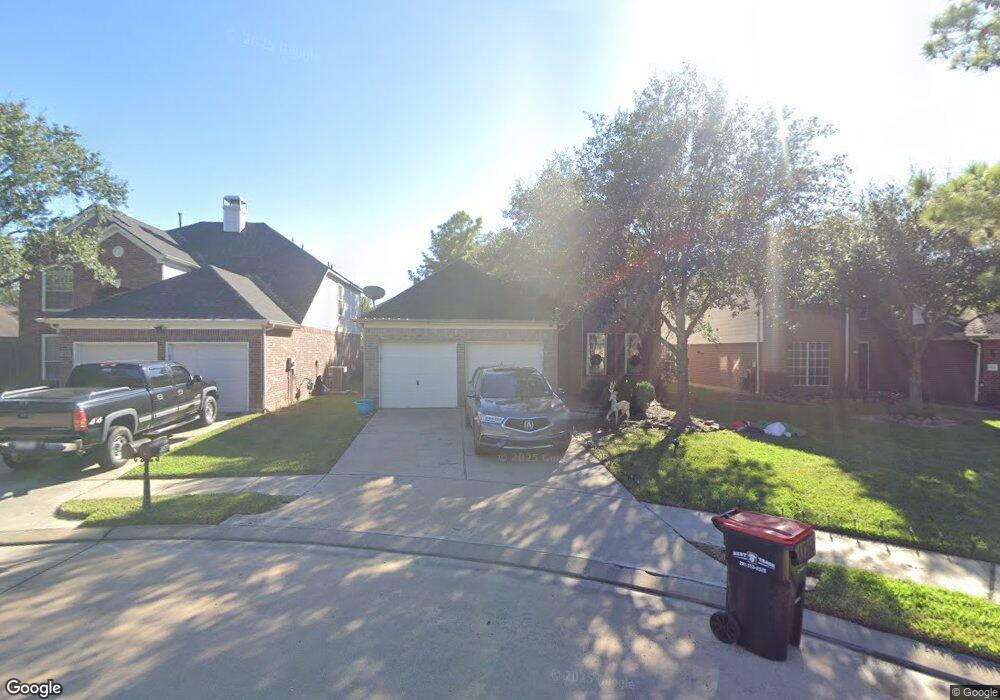
20535 Daisy Bloom Ct Cypress, TX 77433
Fairfield Village NeighborhoodEstimated Value: $351,342 - $373,000
4
Beds
3
Baths
2,516
Sq Ft
$144/Sq Ft
Est. Value
About This Home
This home is located at 20535 Daisy Bloom Ct, Cypress, TX 77433 and is currently estimated at $362,336, approximately $144 per square foot. 20535 Daisy Bloom Ct is a home located in Harris County with nearby schools including Keith Elementary School, Salyards Middle, and Bridgeland High School.
Ownership History
Date
Name
Owned For
Owner Type
Purchase Details
Closed on
Jul 7, 2011
Sold by
Sarine Scott Ross and Sarine Emily Dicken
Bought by
Leu Andrea Nicole and Leu Gifford Kevin
Current Estimated Value
Home Financials for this Owner
Home Financials are based on the most recent Mortgage that was taken out on this home.
Original Mortgage
$154,969
Outstanding Balance
$111,455
Interest Rate
5.5%
Mortgage Type
FHA
Estimated Equity
$250,881
Purchase Details
Closed on
Feb 16, 2010
Sold by
Carlson John Michael and Carlson Sarah Belen
Bought by
Sarine Scott Ross
Home Financials for this Owner
Home Financials are based on the most recent Mortgage that was taken out on this home.
Original Mortgage
$127,600
Interest Rate
5.11%
Mortgage Type
New Conventional
Purchase Details
Closed on
Mar 9, 2006
Sold by
Perry Homes
Bought by
Carlson John Michael and Carlson Sarah Belen
Home Financials for this Owner
Home Financials are based on the most recent Mortgage that was taken out on this home.
Original Mortgage
$127,200
Interest Rate
6.19%
Mortgage Type
Fannie Mae Freddie Mac
Create a Home Valuation Report for This Property
The Home Valuation Report is an in-depth analysis detailing your home's value as well as a comparison with similar homes in the area
Home Values in the Area
Average Home Value in this Area
Purchase History
| Date | Buyer | Sale Price | Title Company |
|---|---|---|---|
| Leu Andrea Nicole | -- | Stewart Title | |
| Sarine Scott Ross | -- | Stewart Title Houston Div | |
| Carlson John Michael | -- | Chicago Title |
Source: Public Records
Mortgage History
| Date | Status | Borrower | Loan Amount |
|---|---|---|---|
| Open | Leu Andrea Nicole | $154,969 | |
| Previous Owner | Sarine Scott Ross | $127,600 | |
| Previous Owner | Carlson John Michael | $127,200 |
Source: Public Records
Tax History Compared to Growth
Tax History
| Year | Tax Paid | Tax Assessment Tax Assessment Total Assessment is a certain percentage of the fair market value that is determined by local assessors to be the total taxable value of land and additions on the property. | Land | Improvement |
|---|---|---|---|---|
| 2025 | $5,274 | $350,344 | $67,567 | $282,777 |
| 2024 | $5,274 | $353,969 | $67,567 | $286,402 |
| 2023 | $5,274 | $355,478 | $67,567 | $287,911 |
| 2022 | $7,026 | $320,528 | $61,546 | $258,982 |
| 2021 | $6,743 | $257,769 | $61,546 | $196,223 |
| 2020 | $6,573 | $242,624 | $38,466 | $204,158 |
| 2019 | $6,779 | $241,194 | $30,439 | $210,755 |
| 2018 | $2,222 | $224,125 | $30,439 | $193,686 |
| 2017 | $6,379 | $224,125 | $30,439 | $193,686 |
| 2016 | $6,032 | $211,935 | $30,439 | $181,496 |
| 2015 | $4,353 | $211,935 | $30,439 | $181,496 |
| 2014 | $4,353 | $182,945 | $30,439 | $152,506 |
Source: Public Records
Map
Nearby Homes
- 20622 Tulip Blossom Ct
- 20527 S Blue Hyacinth Dr
- 20815 Golden Sycamore Trail
- 20714 N Blue Hyacinth Dr
- 20803 Twisted Leaf Dr
- 20906 Ochre Willow Trail
- 20807 Twisted Leaf Dr
- 16603 Radiant Lilac Trail
- 16703 Radiant Lilac Trail
- 20110 Fairfield Trace Dr
- 20207 Fairfield Trace Dr
- 16714 Radiant Lilac Trail
- 15003 Big Spring Park Dr
- 16018 Lower Lake Dr
- 18234 Shoreline Vista Ln
- 15918 Lake Loop Dr
- 15334 Sienna Oak Dr
- 16722 Orchid Mist Dr
- 15403 Court Green Trail
- 11018 White Caterpillar Dr
- 20531 Daisy Bloom Ct
- 20603 Tulip Blossom Ct
- 20527 Daisy Bloom Ct
- 20607 Tulip Blossom Ct
- 20538 Mauve Orchid Way
- 20534 Mauve Orchid Way
- 20602 Mauve Orchid Way
- 20530 Mauve Orchid Way
- 20611 Tulip Blossom Ct
- 20606 Mauve Orchid Way
- 20526 Mauve Orchid Way
- 20534 Daisy Bloom Ct
- 20610 Mauve Orchid Way
- 20530 Daisy Bloom Ct
- 20602 Tulip Blossom Ct
- 20519 Daisy Bloom Ct
- 20526 Daisy Bloom Ct
- 21807 Blue Daisy Ct
- 21826 Blue Daisy Ct
- 20522 Mauve Orchid Way