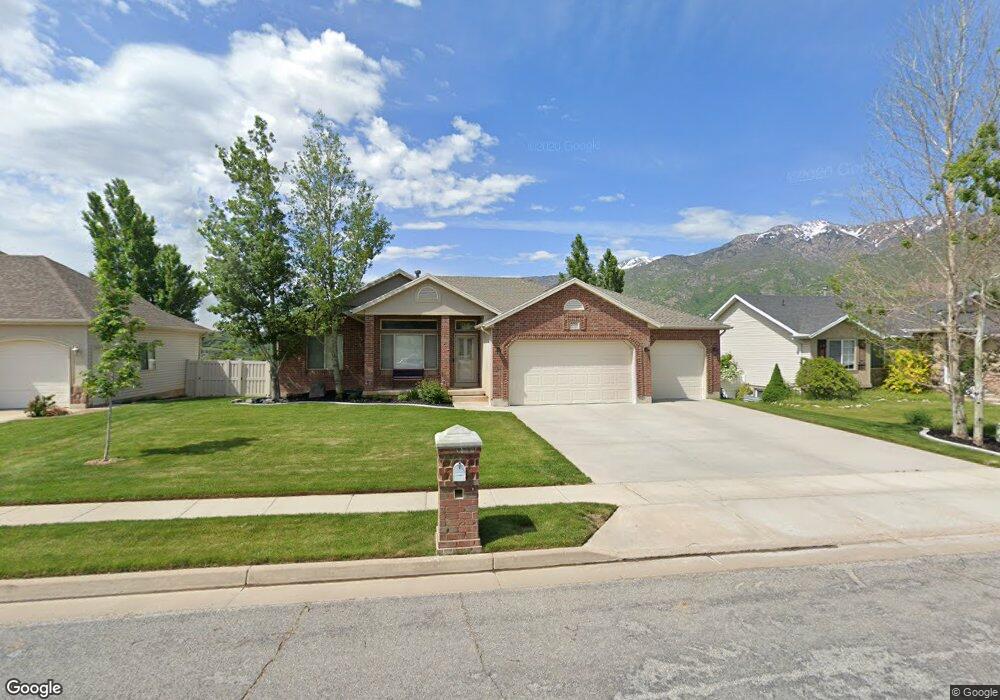
2054 E View Dr Unit 20 South Weber, UT 84405
Estimated Value: $659,658 - $704,000
5
Beds
4
Baths
2,010
Sq Ft
$340/Sq Ft
Est. Value
About This Home
This home is located at 2054 E View Dr Unit 20, South Weber, UT 84405 and is currently estimated at $683,415, approximately $340 per square foot. 2054 E View Dr Unit 20 is a home located in Davis County with nearby schools including South Weber Elementary School, Sunset Junior High School, and Northridge High School.
Ownership History
Date
Name
Owned For
Owner Type
Purchase Details
Closed on
May 24, 2016
Sold by
Ingleby Richard M and Ingleby Kindall
Bought by
Orzechowski Richard C and Orzechowski Cassandra
Current Estimated Value
Purchase Details
Closed on
Aug 1, 2014
Sold by
Powers James A and Powers Patricia Jean
Bought by
Ingleby Richard M and Ingleby Kindall
Home Financials for this Owner
Home Financials are based on the most recent Mortgage that was taken out on this home.
Original Mortgage
$340,890
Interest Rate
1.75%
Mortgage Type
VA
Purchase Details
Closed on
Aug 21, 2006
Sold by
Powers James A and Powers Patricia J
Bought by
Powers James A and Powers Patricia Jean
Purchase Details
Closed on
Dec 1, 2000
Sold by
Main Street Builders Inc
Bought by
Powers James A and Powers Patricia J
Home Financials for this Owner
Home Financials are based on the most recent Mortgage that was taken out on this home.
Original Mortgage
$181,100
Interest Rate
7.66%
Create a Home Valuation Report for This Property
The Home Valuation Report is an in-depth analysis detailing your home's value as well as a comparison with similar homes in the area
Purchase History
| Date | Buyer | Sale Price | Title Company |
|---|---|---|---|
| Orzechowski Richard C | -- | Stewart Title | |
| Ingleby Richard M | -- | Old Republic National Title | |
| Powers James A | -- | None Available | |
| Powers James A | -- | Heritage West Title Insuranc | |
| Main Street Builders Inc | -- | Security Title Company |
Source: Public Records
Mortgage History
| Date | Status | Borrower | Loan Amount |
|---|---|---|---|
| Previous Owner | Ingleby Richard M | $340,890 | |
| Previous Owner | Powers James A | $181,100 |
Source: Public Records
Tax History
| Year | Tax Paid | Tax Assessment Tax Assessment Total Assessment is a certain percentage of the fair market value that is determined by local assessors to be the total taxable value of land and additions on the property. | Land | Improvement |
|---|---|---|---|---|
| 2025 | $3,952 | $355,850 | $125,104 | $230,746 |
| 2024 | $3,671 | $338,249 | $101,927 | $236,322 |
| 2023 | $3,677 | $340,450 | $90,800 | $249,649 |
| 2022 | $3,829 | $703,000 | $149,180 | $553,820 |
| 2021 | $3,263 | $503,000 | $122,458 | $380,542 |
| 2020 | $2,923 | $439,000 | $114,025 | $324,975 |
| 2019 | $2,892 | $424,000 | $109,984 | $314,016 |
| 2018 | $2,569 | $396,000 | $101,011 | $294,989 |
| 2016 | $2,368 | $190,630 | $41,927 | $148,703 |
| 2015 | $2,314 | $176,220 | $41,927 | $134,293 |
| 2014 | $2,060 | $159,769 | $48,192 | $111,577 |
| 2013 | $2,080 | $152,927 | $36,163 | $116,764 |
Source: Public Records
Map
Nearby Homes
- 7478 1980 E
- 7886 S 2100 E
- 7212 S Harolds Way
- 7841 Peachwood Dr
- 1873 E 7600 S
- 2357 E 8100 S
- 2586 Deer Run Dr
- 1458 E South Weber Dr
- 1577 E South Weber Dr Unit 3
- 8036 S 2575 E
- 7897 S 2700 E Unit 303
- 7897 S 2700 E Unit 305
- 2765 E 7825 S
- 2553 E 6550 S
- 1593 E 6600 S
- 7484 S 1160 E Unit 1
- 1119 E South Bench Dr Unit 9
- 1042 E Lester Dr
- 2772 E 3575 N
- 2237 E Parkside Cir
- 2054 E View Dr
- 2036 E View Dr Unit 19
- 2060 E View Dr
- 2028 E View Dr
- 2028 E View Dr Unit 18
- 2068 E View Dr
- 2036 View Dr
- 7630 S 2050 E
- 2065 View Dr
- 2065 E View Dr Unit 28
- 7588 S 2020 E
- 2033 View Dr
- 7629 S 2050 E Unit 33
- 7629 S 2050 E
- 7580 S 2020 E
- 2076 E View Dr
- 2076 E View Dr
- 7581 S 2020 E
- 2010 View Dr
- 7585 S 2050 E
Your Personal Tour Guide
Ask me questions while you tour the home.