K
Landlord's Agent in 2022
Kevin Niner
EXP Realty, LLC
(703) 403-0094
2 Total Sales


Estimated Value: $324,000
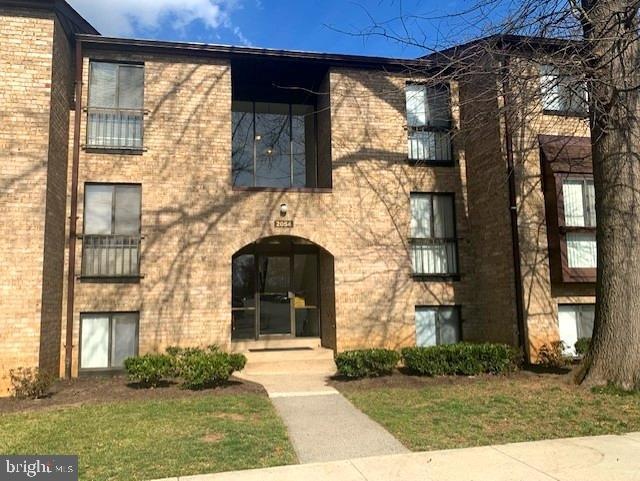
Adorable, well maintained 2 BR 1 bath condo with bright natural lights and tons of windows in quiet neighborhood. Unit is close to malls, shops and school. Soft Carpet throughout living room, dining room and bedrooms. Condo fee (included in rent) includes Gas (heating + cooking), water, trash, recycle, snow removal, exterior maintenance and a storage unit. Parking includes one reserved space (#203) & one resident/guest parking passe. These passes can also be used for any non-reserved spaces. Separate secured storage area comes with the unit as well. Close access to Reston Community Center and Safeway shopping center on Colts Neck Rd. Easy access to Reston Town Center and its exciting vibe and shops and restaurants. Silver Line Metro (Wiehle/Reston) METRO is just a short drive or walk or bike ride and less than 10 minutes to Dulles International Airport. Landlord is extremely friendly and will manage the unit. Contact agent for showing or to Apply online. Available NOW!!!
Last Agent to Rent the Property
(703) 403-0094 kevin.niner@exprealty.com EXP Realty, LLC Listed on: 02/26/2022

| Date | Buyer | Sale Price | Title Company |
|---|---|---|---|
| Mb Group Llc | $245,000 | Chicago Title Insurance Co | |
| Bellanca Thomas E | $72,000 | -- |
| Date | Event | Price | List to Sale | Price per Sq Ft |
|---|---|---|---|---|
| 04/15/2022 04/15/22 | Rented | $1,850 | 0.0% | -- |
| 04/02/2022 04/02/22 | Under Contract | -- | -- | -- |
| 03/25/2022 03/25/22 | Price Changed | $1,850 | -2.6% | $2 / Sq Ft |
| 02/26/2022 02/26/22 | For Rent | $1,900 | -- | -- |
| Year | Tax Paid | Tax Assessment Tax Assessment Total Assessment is a certain percentage of the fair market value that is determined by local assessors to be the total taxable value of land and additions on the property. | Land | Improvement |
|---|---|---|---|---|
| 2025 | $3,403 | $290,780 | $58,000 | $232,780 |
| 2024 | $3,403 | $282,310 | $56,000 | $226,310 |
| 2023 | $3,073 | $261,400 | $52,000 | $209,400 |
| 2022 | $2,779 | $233,390 | $47,000 | $186,390 |
| 2021 | $2,739 | $224,410 | $45,000 | $179,410 |
| 2020 | $2,605 | $211,710 | $42,000 | $169,710 |
| 2019 | $2,605 | $211,710 | $43,000 | $168,710 |
| 2018 | $2,113 | $183,700 | $37,000 | $146,700 |
| 2017 | $2,219 | $183,700 | $37,000 | $146,700 |
| 2016 | $2,291 | $190,020 | $38,000 | $152,020 |
| 2015 | $2,210 | $190,020 | $38,000 | $152,020 |
| 2014 | $1,866 | $160,830 | $32,000 | $128,830 |
K
Landlord's Agent in 2022
Kevin Niner
EXP Realty, LLC
(703) 403-0094
2 Total Sales
Tenant's Agent in 2022
Drew Hoffecker
Real Broker, LLC
(202) 409-2085
8 in this area
60 Total Sales
Source: Bright MLS
MLS Number: VAFX2052584
APN: 0173-06240002B
Disclaimer: Certain information contained herein is derived from information provided by parties other than Homes.com. All information provided is deemed reliable, but is not guaranteed to be accurate and should be independently verified.
![]() The data relating to real estate for sale on this website appears in part through the BRIGHT Internet Data Exchange program, a voluntary cooperative exchange of property listing data between licensed real estate brokerage firms, and is provided by BRIGHT through a licensing agreement.
The data relating to real estate for sale on this website appears in part through the BRIGHT Internet Data Exchange program, a voluntary cooperative exchange of property listing data between licensed real estate brokerage firms, and is provided by BRIGHT through a licensing agreement.
Listing information is from various brokers who participate in the Bright MLS IDX program and not all listings may be visible on the site.
The property information being provided on or through the website is for the personal, non-commercial use of consumers and such information may not be used for any purpose other than to identify prospective properties consumers may be interested in purchasing.
Some properties which appear for sale on the website may no longer be available because they are for instance, under contract, sold or are no longer being offered for sale.
Property information displayed is deemed reliable but is not guaranteed.
Copyright 2025 Bright MLS, Inc.