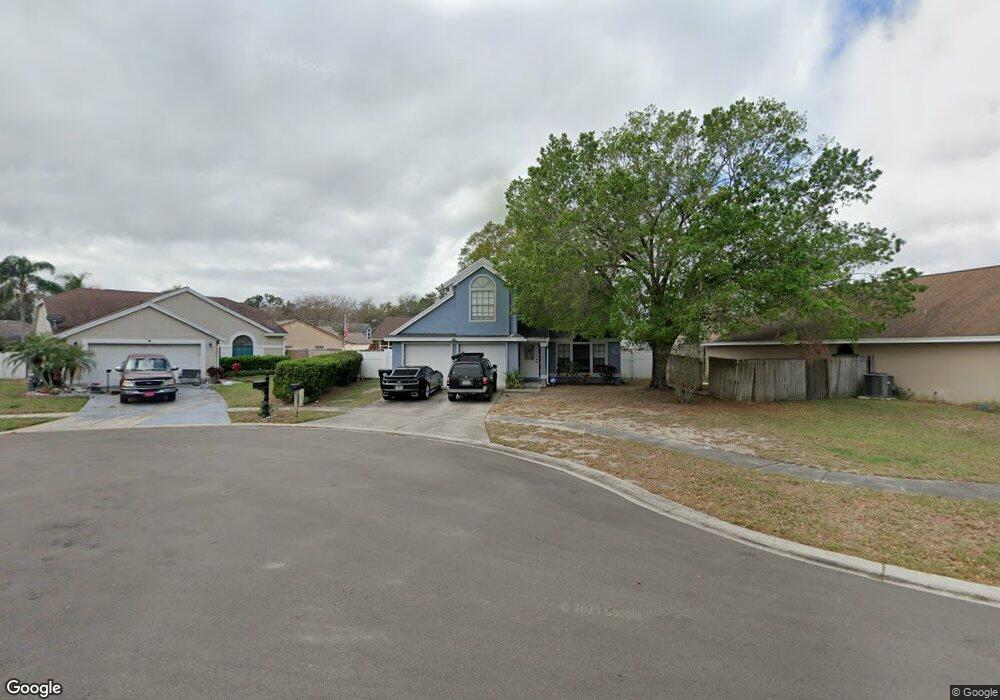
2054 Sue Ellen Ct Apopka, FL 32703
Estimated Value: $345,000 - $384,000
4
Beds
3
Baths
2,285
Sq Ft
$156/Sq Ft
Est. Value
About This Home
This home is located at 2054 Sue Ellen Ct, Apopka, FL 32703 and is currently estimated at $356,999, approximately $156 per square foot. 2054 Sue Ellen Ct is a home located in Orange County with nearby schools including Lakeville Elementary School, Piedmont Lakes Middle School, and Wekiva High School.
Ownership History
Date
Name
Owned For
Owner Type
Purchase Details
Closed on
Jun 1, 2015
Sold by
Coles Hills Llc
Bought by
Arroyo Chris A
Current Estimated Value
Home Financials for this Owner
Home Financials are based on the most recent Mortgage that was taken out on this home.
Original Mortgage
$158,110
Outstanding Balance
$122,635
Interest Rate
3.79%
Mortgage Type
New Conventional
Estimated Equity
$234,364
Purchase Details
Closed on
Dec 10, 2014
Sold by
U S Bank National Association
Bought by
Coles Hills Llc
Purchase Details
Closed on
Apr 2, 2014
Sold by
Kotrasen Palung and Srisuthapan Kotrasen Thaninee
Bought by
Us Bank National Association
Purchase Details
Closed on
May 7, 2013
Sold by
Kotrasen Palung and Kotrasen Srisuthapan Thaninnee
Bought by
Dominguez Meera
Purchase Details
Closed on
Jan 7, 2004
Sold by
Kotrasen Pundit and Kotrasen Chanida
Bought by
Kotrasen Palung and Kotrasen Thaninee Srisuthapan
Create a Home Valuation Report for This Property
The Home Valuation Report is an in-depth analysis detailing your home's value as well as a comparison with similar homes in the area
Home Values in the Area
Average Home Value in this Area
Purchase History
| Date | Buyer | Sale Price | Title Company |
|---|---|---|---|
| Arroyo Chris A | $165,000 | First Signature Title Inc | |
| Coles Hills Llc | $100,000 | Buyers Title Inc | |
| Us Bank National Association | $99,900 | Attorney | |
| Dominguez Meera | $5,300 | None Available | |
| Kotrasen Palung | -- | -- |
Source: Public Records
Mortgage History
| Date | Status | Borrower | Loan Amount |
|---|---|---|---|
| Open | Arroyo Chris A | $158,110 |
Source: Public Records
Tax History
| Year | Tax Paid | Tax Assessment Tax Assessment Total Assessment is a certain percentage of the fair market value that is determined by local assessors to be the total taxable value of land and additions on the property. | Land | Improvement |
|---|---|---|---|---|
| 2025 | $4,961 | $307,560 | $95,000 | $212,560 |
| 2024 | $4,477 | $297,790 | $95,000 | $202,790 |
| 2023 | $4,477 | $283,173 | $95,000 | $188,173 |
| 2022 | $1,713 | $147,477 | $0 | $0 |
| 2021 | $1,680 | $143,182 | $0 | $0 |
| 2020 | $1,605 | $141,205 | $0 | $0 |
| 2019 | $1,629 | $138,030 | $0 | $0 |
| 2018 | $1,609 | $135,456 | $0 | $0 |
| 2017 | $1,563 | $148,146 | $35,000 | $113,146 |
| 2016 | $1,555 | $129,941 | $20,000 | $109,941 |
| 2015 | $2,069 | $122,981 | $20,000 | $102,981 |
| 2014 | $1,786 | $104,280 | $20,000 | $84,280 |
Source: Public Records
Map
Nearby Homes
- 2059 Sue Ellen Ct
- 2010 Lakeville Rd
- 1432 Crawford Dr
- 1981 Frenzel Dr
- 1366 Wildwood St
- 1352 Woodfield Oaks Dr
- 1920 Tindaro Dr
- 1250 Lacey Oak Dr
- 1256 Pin Oak Dr
- 1223 Lacey Oak Dr
- 2074 Wenthworth Cir
- 1254 Indian Bluff Dr
- 1708 Chatham Cir
- 1928 Larkwood Dr
- 1196 Indian Bluff Dr
- 1821 Concord Dr
- 0 Sheeler Oaks Dr Unit MFRO6337662
- 1777 Summit Chase Ave
- 1124 Mill Run Cir
- 1760 Saddleback Ridge Rd
- 2050 Sue Ellen Ct
- 2058 Sue Ellen Ct
- 2055 Inge Ct
- 1476 Margarete Crescent Dr
- 2062 Sue Ellen Ct
- 2047 Inge Ct
- 1552 Margarete Crescent Dr
- 2039 Inge Ct
- 2063 Inge Ct
- 2055 Sue Ellen Ct
- 2066 Sue Ellen Ct
- 1472 Margarete Crescent Dr
- 1554 Margarete Crescent Dr
- 1525 Crawford Dr
- 1533 Crawford Dr
- 1541 Crawford Dr
- 1517 Crawford Dr
- 2029 Wildfire Ct
- 1549 Crawford Dr
Your Personal Tour Guide
Ask me questions while you tour the home.