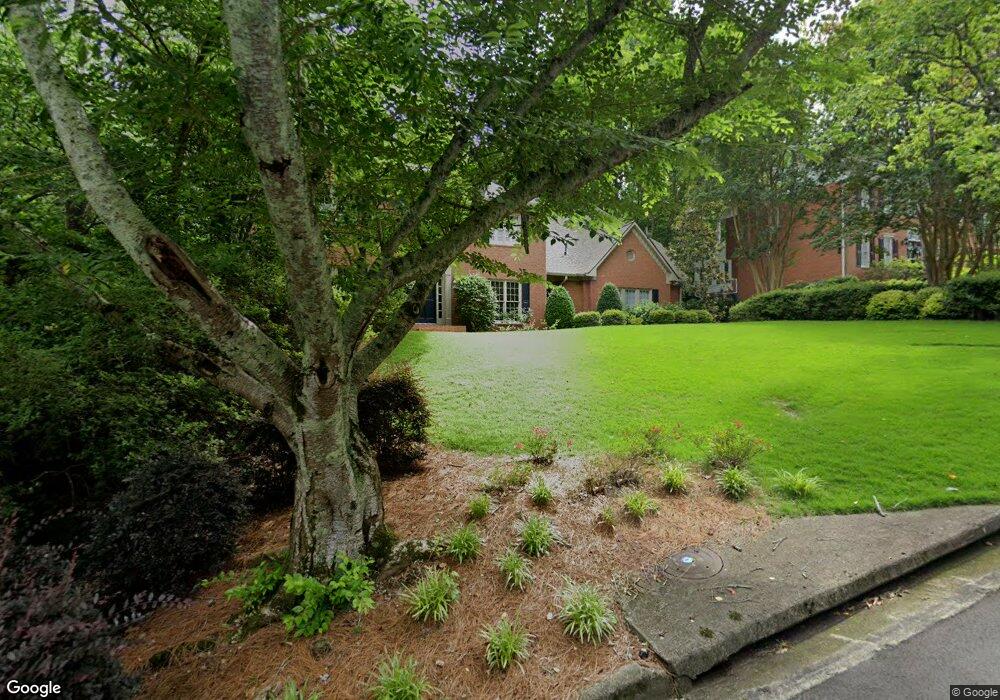
2055 Azalea Dr Unit 2055 Roswell, GA 30075
Estimated Value: $820,782 - $923,000
4
Beds
3
Baths
2,967
Sq Ft
$291/Sq Ft
Est. Value
About This Home
This home is located at 2055 Azalea Dr Unit 2055, Roswell, GA 30075 and is currently estimated at $863,946, approximately $291 per square foot. 2055 Azalea Dr Unit 2055 is a home located in Fulton County with nearby schools including Roswell North Elementary School, Crabapple Middle School, and High Meadows School.
Ownership History
Date
Name
Owned For
Owner Type
Purchase Details
Closed on
Nov 16, 2023
Sold by
Nielson Doug
Bought by
Nielson Living Trust and Nielson Douglas Tr
Current Estimated Value
Purchase Details
Closed on
Jun 5, 2012
Sold by
Kyriakou Christos S
Bought by
Neilson Doug and Neilson Mary Lynne
Purchase Details
Closed on
Sep 28, 2000
Sold by
Kyriakou Christos S
Bought by
Kyriakou Christos S and Kyriakou Barbara L
Home Financials for this Owner
Home Financials are based on the most recent Mortgage that was taken out on this home.
Original Mortgage
$251,700
Interest Rate
7.96%
Mortgage Type
New Conventional
Purchase Details
Closed on
May 4, 1998
Sold by
Vanbeuningen Hendrick A and Vanbeuningen Sally A
Bought by
Roth Stephen A and Roth Linda N
Home Financials for this Owner
Home Financials are based on the most recent Mortgage that was taken out on this home.
Original Mortgage
$110,000
Interest Rate
7.03%
Mortgage Type
New Conventional
Create a Home Valuation Report for This Property
The Home Valuation Report is an in-depth analysis detailing your home's value as well as a comparison with similar homes in the area
Home Values in the Area
Average Home Value in this Area
Purchase History
| Date | Buyer | Sale Price | Title Company |
|---|---|---|---|
| Nielson Living Trust | -- | -- | |
| Neilson Doug | $367,500 | -- | |
| Kyriakou Christos S | -- | -- | |
| Kyriakou Christos S | $335,000 | -- | |
| Roth Stephen A | $309,900 | -- |
Source: Public Records
Mortgage History
| Date | Status | Borrower | Loan Amount |
|---|---|---|---|
| Previous Owner | Kyriakou Christos S | $251,700 | |
| Previous Owner | Roth Stephen A | $110,000 |
Source: Public Records
Tax History Compared to Growth
Tax History
| Year | Tax Paid | Tax Assessment Tax Assessment Total Assessment is a certain percentage of the fair market value that is determined by local assessors to be the total taxable value of land and additions on the property. | Land | Improvement |
|---|---|---|---|---|
| 2025 | $1,019 | $231,640 | $66,000 | $165,640 |
| 2023 | $7,129 | $252,560 | $95,480 | $157,080 |
| 2022 | $4,255 | $214,160 | $53,560 | $160,600 |
| 2021 | $5,071 | $200,640 | $48,760 | $151,880 |
| 2020 | $5,140 | $191,840 | $41,280 | $150,560 |
| 2019 | $848 | $188,440 | $40,560 | $147,880 |
| 2018 | $4,457 | $184,040 | $39,600 | $144,440 |
| 2017 | $4,197 | $163,320 | $33,200 | $130,120 |
| 2016 | $4,176 | $163,320 | $33,200 | $130,120 |
| 2015 | $5,082 | $163,320 | $33,200 | $130,120 |
| 2014 | $3,839 | $138,000 | $28,040 | $109,960 |
Source: Public Records
Map
Nearby Homes
- 355 Highlands Trace
- 9035 Sandorn Dr
- 8075 Sandorn Dr
- 3016 Glendower Way
- 8035 Sandorn Dr
- The Carrington Plan at Hillandale in Historic Roswell
- The Rocklyn Plan at Hillandale in Historic Roswell
- The Grafton Plan at Hillandale in Historic Roswell
- The Greighton Plan at Hillandale in Historic Roswell
- 605 Ga 120 Hwy
- 4035 Connolly Ct
- 830 Willeo Rd
- 3210 Lake Pointe Cir
- 9480 Coleman Rd
- 657 Willeo Rd
- 1204 Lake Pointe Cir
- 4013 Lake Pointe Cir Unit 4013
- 3113 Lake Pointe Cir
- 1009 Lake Pointe Cir
- 2055 Azalea Dr
- 2045 Azalea Dr
- 2065 Azalea Dr
- 2075 Azalea Dr
- 2060 Azalea Dr
- 2050 Azalea Dr
- 2035 Azalea Dr
- 2040 Azalea Dr
- 2085 Azalea Dr
- 2070 Azalea Dr
- 2030 Azalea Dr
- 610 Highlands Ct
- 615 Highlands Ct
- 2095 Azalea Dr
- 625 Highlands Ct
- 620 Highlands Ct
- 630 Highlands Ct
- 305 Highlands Trace Unit 33
- 305 Highlands Trace
- 315 Highlands Trace