Estimated Value: $390,000 - $425,000
4
Beds
2
Baths
1,920
Sq Ft
$214/Sq Ft
Est. Value
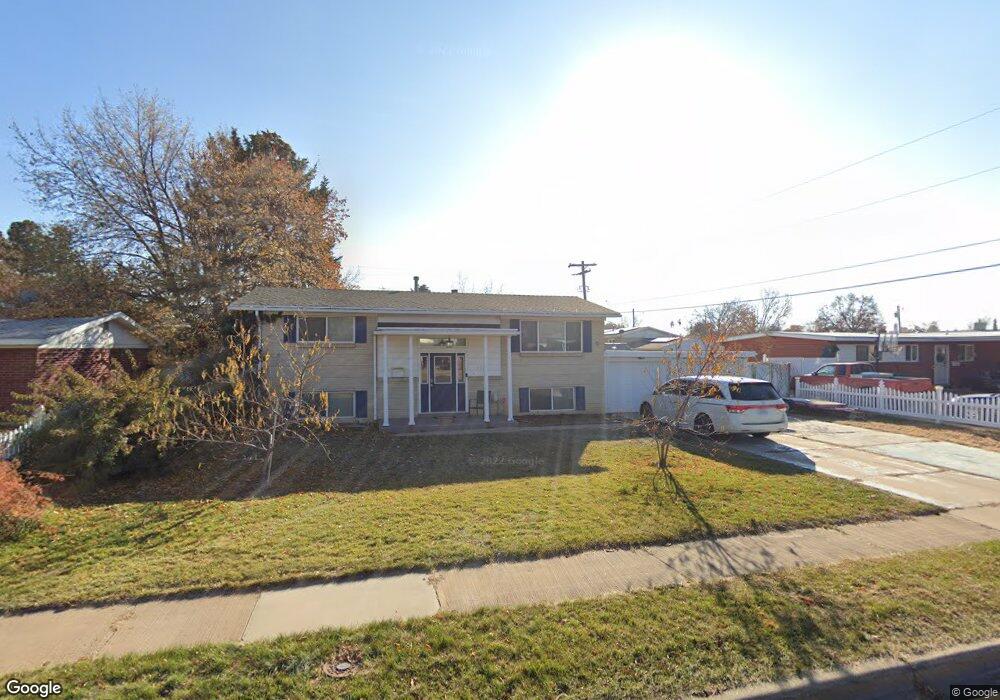
About This Home
This home is located at 2055 W 4225 S, Roy, UT 84067 and is currently estimated at $410,587, approximately $213 per square foot. 2055 W 4225 S is a home located in Weber County with nearby schools including North Park School, Sand Ridge Junior High School, and Roy High School.
Ownership History
Date
Name
Owned For
Owner Type
Purchase Details
Closed on
Nov 20, 2012
Sold by
Whitworth Timothy B and Whitworth Tyann M
Bought by
Etterley Crown Michael W
Current Estimated Value
Home Financials for this Owner
Home Financials are based on the most recent Mortgage that was taken out on this home.
Original Mortgage
$145,461
Outstanding Balance
$100,326
Interest Rate
3.35%
Mortgage Type
VA
Estimated Equity
$310,261
Purchase Details
Closed on
May 23, 2011
Sold by
Mayberry Sharon W
Bought by
Whitworth Timothy B and Whitworth Tyann M
Home Financials for this Owner
Home Financials are based on the most recent Mortgage that was taken out on this home.
Original Mortgage
$128,653
Interest Rate
4.87%
Mortgage Type
FHA
Create a Home Valuation Report for This Property
The Home Valuation Report is an in-depth analysis detailing your home's value as well as a comparison with similar homes in the area
Home Values in the Area
Average Home Value in this Area
Purchase History
| Date | Buyer | Sale Price | Title Company |
|---|---|---|---|
| Etterley Crown Michael W | -- | Mountain America Title | |
| Whitworth Timothy B | -- | Inwest Title Svcs Salt Lake |
Source: Public Records
Mortgage History
| Date | Status | Borrower | Loan Amount |
|---|---|---|---|
| Open | Etterley Crown Michael W | $145,461 | |
| Previous Owner | Whitworth Timothy B | $128,653 |
Source: Public Records
Tax History
| Year | Tax Paid | Tax Assessment Tax Assessment Total Assessment is a certain percentage of the fair market value that is determined by local assessors to be the total taxable value of land and additions on the property. | Land | Improvement |
|---|---|---|---|---|
| 2025 | $2,520 | $397,709 | $122,063 | $275,646 |
| 2024 | $2,460 | $215,049 | $67,142 | $147,907 |
| 2023 | $2,374 | $207,900 | $61,979 | $145,921 |
| 2022 | $2,319 | $208,450 | $54,213 | $154,237 |
| 2021 | $1,889 | $278,000 | $68,740 | $209,260 |
| 2020 | $1,696 | $228,000 | $68,740 | $159,260 |
| 2019 | $1,624 | $205,000 | $39,523 | $165,477 |
| 2018 | $1,507 | $178,000 | $36,510 | $141,490 |
| 2017 | $1,515 | $168,762 | $36,510 | $132,252 |
| 2016 | $1,343 | $79,295 | $17,627 | $61,668 |
| 2015 | $1,251 | $75,443 | $17,627 | $57,816 |
| 2014 | $1,262 | $75,443 | $17,627 | $57,816 |
Source: Public Records
Map
Nearby Homes
- 2015 W 4225 S
- 4103 S 2175 W
- 4061 S 2175 W
- 2015 W 4450 S
- 4047 S 2175 W
- 2267 W 4350 S
- 1959 3985 St S Unit 2
- 3980 S 1950 W Unit 31
- 4164 S 2400 W
- 4046 Sandridge Dr Unit 3
- 4046 Sandridge Dr Unit 2
- 4046 Sandridge Dr
- 4046 Sandridge Dr Unit 1
- 3923 S 1975 W Unit 15
- 3975 S 2225 W
- 1940 W 3920 S
- 1910 W 3920 S
- 4082 S Sandridge Dr Unit 7
- 4082 S Sandridge Dr Unit 5
- 4082 S Sandridge Dr
Your Personal Tour Guide
Ask me questions while you tour the home.