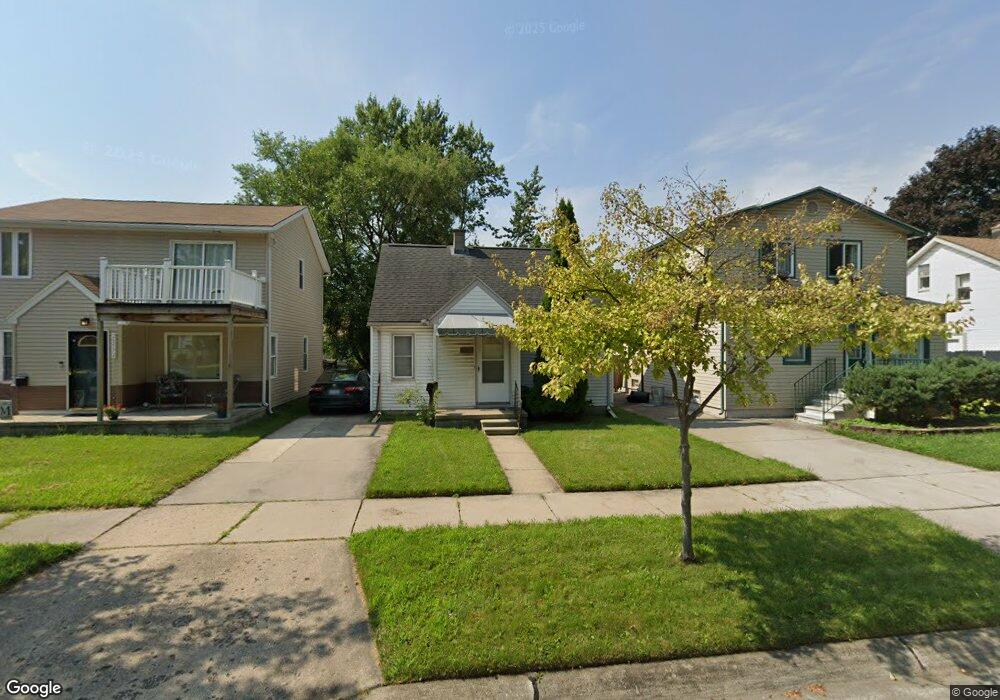
20556 Ridgemont Rd Unit Bldg-Unit Harper Woods, MI 48225
Estimated Value: $143,000 - $179,331
--
Bed
2
Baths
1,275
Sq Ft
$123/Sq Ft
Est. Value
About This Home
This home is located at 20556 Ridgemont Rd Unit Bldg-Unit, Harper Woods, MI 48225 and is currently estimated at $157,333, approximately $123 per square foot. 20556 Ridgemont Rd Unit Bldg-Unit is a home located in Wayne County with nearby schools including Parcells Middle School, Grosse Pointe North High School, and Chandler Park Academy Middle School.
Ownership History
Date
Name
Owned For
Owner Type
Purchase Details
Closed on
Feb 2, 2024
Sold by
Ricci Dino R and Ricci Julie M
Bought by
Ricci Amelia M and Ricci Dino R
Current Estimated Value
Purchase Details
Closed on
May 4, 2018
Sold by
Rutkelis Amanda Rose
Bought by
Ricci Dino R
Purchase Details
Closed on
Jun 16, 2016
Sold by
Anderson Jason
Bought by
Rutkelis Amanda Rose
Purchase Details
Closed on
Nov 11, 2009
Sold by
Dziarek Maciej S and Schultz Crystal M
Bought by
Federal Home Loan Mortgage Corp
Purchase Details
Closed on
Jun 21, 2007
Sold by
Nirmalon Ruban and Nirmalon Suzanne
Bought by
Dziarek Maciej
Purchase Details
Closed on
Jun 27, 2002
Sold by
Sobleskie John J
Bought by
Nirmalon Ruban
Purchase Details
Closed on
May 30, 2001
Sold by
Barolo Janet M
Bought by
Sobleskie John
Purchase Details
Closed on
Aug 18, 1995
Sold by
Vogel William C
Bought by
Joseph B Barolo
Create a Home Valuation Report for This Property
The Home Valuation Report is an in-depth analysis detailing your home's value as well as a comparison with similar homes in the area
Home Values in the Area
Average Home Value in this Area
Purchase History
| Date | Buyer | Sale Price | Title Company |
|---|---|---|---|
| Ricci Amelia M | -- | None Listed On Document | |
| Ricci Dino R | $58,200 | Premier Title Agency Llc | |
| Rutkelis Amanda Rose | -- | Attorney | |
| Federal Home Loan Mortgage Corp | $53,000 | None Available | |
| Dziarek Maciej | $99,900 | The Nova Title Agency Llc | |
| Nirmalon Ruban | $96,000 | -- | |
| Sobleskie John | $96,900 | -- | |
| Joseph B Barolo | $69,000 | -- |
Source: Public Records
Tax History Compared to Growth
Tax History
| Year | Tax Paid | Tax Assessment Tax Assessment Total Assessment is a certain percentage of the fair market value that is determined by local assessors to be the total taxable value of land and additions on the property. | Land | Improvement |
|---|---|---|---|---|
| 2025 | $1,057 | $70,800 | $0 | $0 |
| 2024 | $1,057 | $65,700 | $0 | $0 |
| 2023 | $1,009 | $57,700 | $0 | $0 |
| 2022 | $3,824 | $52,100 | $0 | $0 |
| 2021 | $3,659 | $48,100 | $0 | $0 |
| 2019 | $3,577 | $35,400 | $0 | $0 |
| 2018 | $499 | $25,900 | $0 | $0 |
| 2017 | $2,968 | $25,900 | $0 | $0 |
| 2016 | $2,045 | $23,400 | $0 | $0 |
| 2015 | $2,270 | $22,700 | $0 | $0 |
| 2013 | $2,280 | $22,800 | $0 | $0 |
| 2012 | $327 | $23,300 | $4,300 | $19,000 |
Source: Public Records
Map
Nearby Homes
- 20629 Hollywood St
- 20120 Salisbury St
- 20520 Anita St
- 20847 Hollywood St
- 20846 Hampton St
- 20860 Ridgemont Rd
- 20857 Hawthorne St
- 20833 Anita St
- 21525 Brys Dr
- Manchester Plan at Fraser Sqaure
- Davenport Plan at Fraser Sqaure
- 20207 Chalon St
- 20490 van Antwerp St Unit 24
- 20418 Edmunton St
- 21737 Roslyn Rd
- 19713 Ridgemont St Unit 23
- 20025 Chalon St
- 19809 Ridgemont St Unit 45
- 20653 Harper Ave Unit 58
- 20871 van Antwerp St
- 20556 Ridgemont Rd
- 20550 Ridgemont Rd
- 20564 Ridgemont Rd
- 20540 Ridgemont Rd
- 20572 Ridgemont Rd
- 20526 Ridgemont Rd
- 20578 Ridgemont Rd
- 20531 Hollywood St
- 20539 Hollywood St
- 20555 Hollywood St
- 20549 Hollywood St
- 20517 Hollywood St
- 20514 Ridgemont Rd
- 20515 Hollywood St
- 20594 Ridgemont Rd
- 20555 Ridgemont Rd
- 20502 Ridgemont Rd
- 20511 Hollywood St
- 20565 Hollywood St
- 20565 Ridgemont Rd