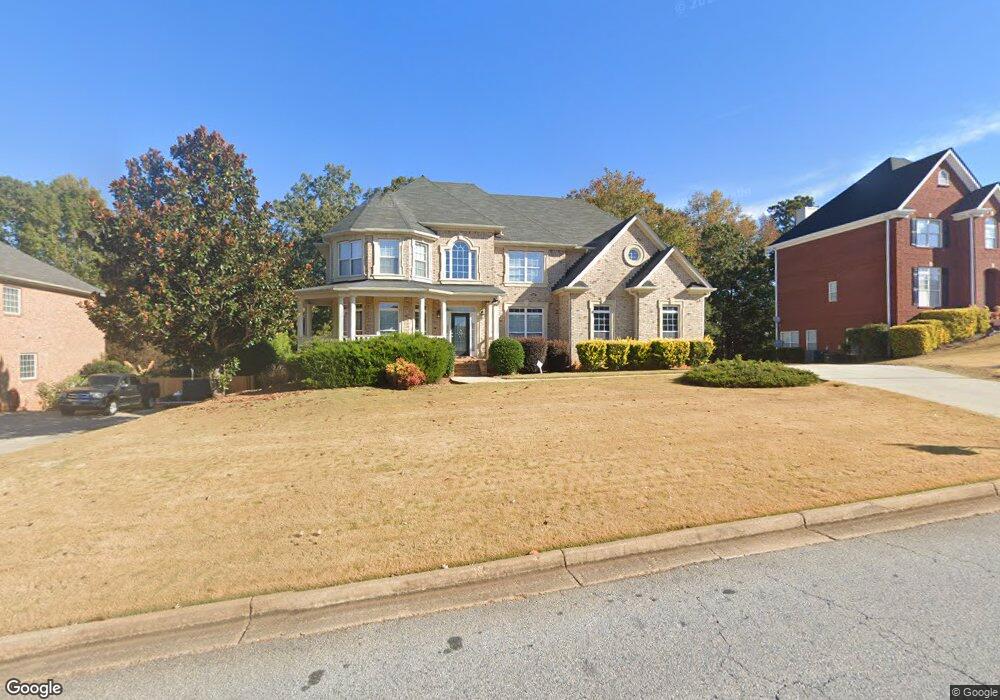
2056 Evergreen Dr SE Conyers, GA 30013
Estimated Value: $488,000 - $543,000
5
Beds
4
Baths
3,167
Sq Ft
$162/Sq Ft
Est. Value
About This Home
This home is located at 2056 Evergreen Dr SE, Conyers, GA 30013 and is currently estimated at $514,543, approximately $162 per square foot. 2056 Evergreen Dr SE is a home located in Rockdale County with nearby schools including Peek's Chapel Elementary School, Memorial Middle School, and Salem High School.
Ownership History
Date
Name
Owned For
Owner Type
Purchase Details
Closed on
Jan 8, 2010
Sold by
Fifth Third Mtg Co
Bought by
Ash Christopher A
Current Estimated Value
Home Financials for this Owner
Home Financials are based on the most recent Mortgage that was taken out on this home.
Original Mortgage
$235,000
Outstanding Balance
$155,927
Interest Rate
5.16%
Mortgage Type
VA
Estimated Equity
$358,616
Purchase Details
Closed on
Jan 6, 2009
Sold by
Green Sheldon
Bought by
Fifth Third Mtg Co
Purchase Details
Closed on
Sep 7, 2005
Sold by
T & T Unlmtd Invest Iinc
Bought by
Thompson Bldrs Inc
Home Financials for this Owner
Home Financials are based on the most recent Mortgage that was taken out on this home.
Original Mortgage
$303,750
Interest Rate
5.86%
Create a Home Valuation Report for This Property
The Home Valuation Report is an in-depth analysis detailing your home's value as well as a comparison with similar homes in the area
Home Values in the Area
Average Home Value in this Area
Purchase History
| Date | Buyer | Sale Price | Title Company |
|---|---|---|---|
| Ash Christopher A | $235,000 | -- | |
| Fifth Third Mtg Co | $272,000 | -- | |
| Thompson Bldrs Inc | $80,000 | -- |
Source: Public Records
Mortgage History
| Date | Status | Borrower | Loan Amount |
|---|---|---|---|
| Open | Ash Christopher A | $235,000 | |
| Previous Owner | Thompson Bldrs Inc | $303,750 |
Source: Public Records
Tax History Compared to Growth
Tax History
| Year | Tax Paid | Tax Assessment Tax Assessment Total Assessment is a certain percentage of the fair market value that is determined by local assessors to be the total taxable value of land and additions on the property. | Land | Improvement |
|---|---|---|---|---|
| 2024 | $6,406 | $250,320 | $34,720 | $215,600 |
| 2023 | $5,762 | $233,560 | $34,720 | $198,840 |
| 2022 | $4,655 | $190,440 | $21,640 | $168,800 |
| 2021 | $4,156 | $159,880 | $21,640 | $138,240 |
| 2020 | $4,468 | $162,680 | $21,800 | $140,880 |
| 2019 | $3,743 | $135,480 | $13,200 | $122,280 |
| 2018 | $3,571 | $129,160 | $13,200 | $115,960 |
| 2017 | $3,195 | $115,640 | $13,200 | $102,440 |
| 2016 | $2,855 | $112,320 | $13,200 | $99,120 |
| 2015 | $2,730 | $107,840 | $13,200 | $94,640 |
| 2014 | $2,370 | $105,200 | $10,560 | $94,640 |
| 2013 | -- | $125,880 | $24,640 | $101,240 |
Source: Public Records
Map
Nearby Homes
- 2052 Evergreen Dr SE
- 3095 Brombley Dr SE
- 2791 Wellington Way SE Unit 1
- 3111 Green Gate Way SE
- 2585 Westchester Way SE
- 1613 Brolington Ct
- 2638 Westchester Pkwy SE
- 3106 Brians Creek Dr SE
- 3113 Brians Creek Dr SE
- 1388 Fall River Dr
- 3205 Haleys Way SE
- 2561 Old Salem Cir SE
- 3226 Old Salem Rd SE
- 1260 Sweet Shrub Ln SE
- 1115 Fountain Crest Dr
- 3225 Haleys Way SE
- 3222 Haleys Way SE
- 2060 Evergreen Dr SE
- 3050 Brombley Dr SE
- 2064 Evergreen Dr SE
- 3060 Brombley Dr SE Unit 1
- 2048 Evergreen Dr SE
- 3220 Leyland Way SE Unit 1
- 2061 Evergreen Dr SE
- 2061 Evergreen Dr SE Unit /139
- 2100 Digby Ct SE
- 3064 Brombley Dr SE
- 3040 Brombley Dr SE
- 2068 Evergreen Dr SE
- 2044 Evergreen Dr SE Unit 1
- 0 Brombley Dr SE Unit 7258638
- 0 Brombley Dr SE Unit 7055906
- 0 Brombley Dr SE Unit 8289259
- 0 Brombley Dr SE Unit 8189648
- 0 Digby Ct SE Unit 8259814
- 3234 Leyland Way SE
- 2104 Digby Ct SE