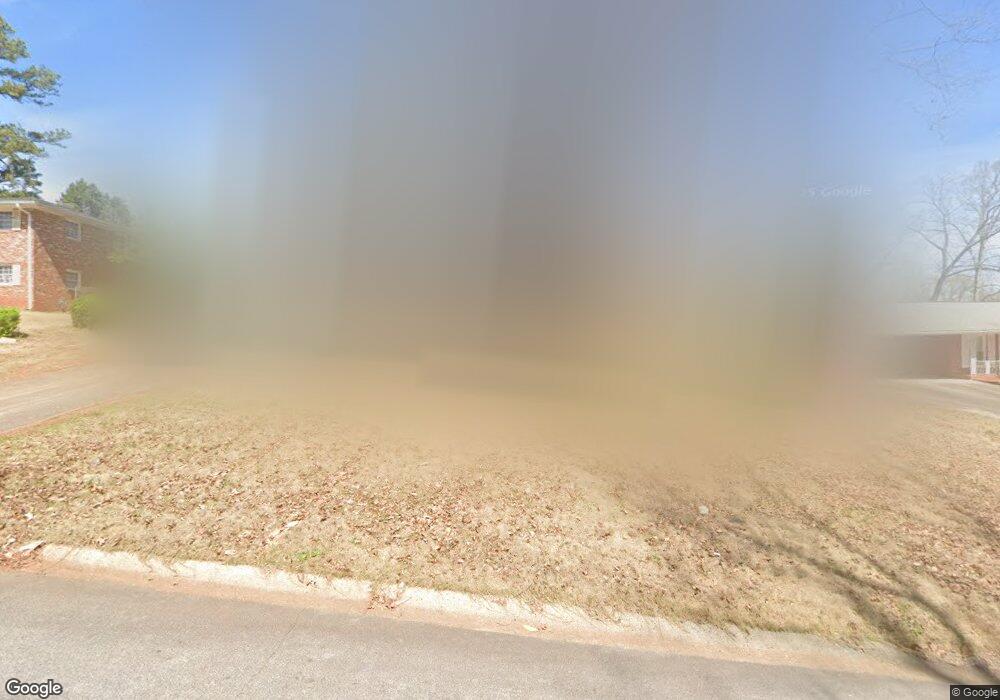
2056 Pinecrest Dr Morrow, GA 30260
Estimated Value: $213,000 - $309,000
3
Beds
2
Baths
1,840
Sq Ft
$132/Sq Ft
Est. Value
About This Home
This home is located at 2056 Pinecrest Dr, Morrow, GA 30260 and is currently estimated at $242,872, approximately $131 per square foot. 2056 Pinecrest Dr is a home located in Clayton County with nearby schools including Morrow Elementary School, Morrow Middle School, and Morrow High School.
Ownership History
Date
Name
Owned For
Owner Type
Purchase Details
Closed on
Aug 26, 2019
Sold by
Atlanta Investor Grp Lp
Bought by
Nguyen Jennifer
Current Estimated Value
Purchase Details
Closed on
Jul 30, 2019
Sold by
Atlanta Investor Grp Lp
Bought by
Mmm Llc
Purchase Details
Closed on
Mar 19, 2019
Sold by
Severson Diana Lynn Suc
Bought by
Atlanta Investor Grp Lp
Home Financials for this Owner
Home Financials are based on the most recent Mortgage that was taken out on this home.
Original Mortgage
$88,000
Interest Rate
4.3%
Mortgage Type
New Conventional
Purchase Details
Closed on
Sep 15, 2010
Sold by
Campbell Mark J and Campbell Lydia V
Bought by
Severson Jerry L and Severson Mary L
Home Financials for this Owner
Home Financials are based on the most recent Mortgage that was taken out on this home.
Original Mortgage
$50,000
Interest Rate
4.45%
Mortgage Type
Trade
Purchase Details
Closed on
Jun 3, 2009
Sold by
Campbell Mark J and Campbell Lydia V
Bought by
Campbell Mark J and Campbell Lydia
Purchase Details
Closed on
Feb 28, 2006
Sold by
Campbell Lydia V
Bought by
Campbell Mark and Campbell Lydia
Create a Home Valuation Report for This Property
The Home Valuation Report is an in-depth analysis detailing your home's value as well as a comparison with similar homes in the area
Home Values in the Area
Average Home Value in this Area
Purchase History
| Date | Buyer | Sale Price | Title Company |
|---|---|---|---|
| Nguyen Jennifer | $115,000 | -- | |
| Atlanta Investor Grp Lp | -- | -- | |
| Mmm Llc | -- | -- | |
| Atlanta Investor Grp Lp | $110,000 | -- | |
| Severson Jerry L | $30,000 | -- | |
| Campbell Mark J | -- | -- | |
| Campbell Mark | -- | -- |
Source: Public Records
Mortgage History
| Date | Status | Borrower | Loan Amount |
|---|---|---|---|
| Previous Owner | Atlanta Investor Grp Lp | $88,000 | |
| Previous Owner | Severson Jerry L | $50,000 |
Source: Public Records
Tax History
| Year | Tax Paid | Tax Assessment Tax Assessment Total Assessment is a certain percentage of the fair market value that is determined by local assessors to be the total taxable value of land and additions on the property. | Land | Improvement |
|---|---|---|---|---|
| 2025 | $3,307 | $85,440 | $8,000 | $77,440 |
| 2024 | $3,351 | $85,000 | $8,000 | $77,000 |
| 2023 | $2,808 | $76,800 | $8,000 | $68,800 |
| 2022 | $2,570 | $64,600 | $8,000 | $56,600 |
| 2021 | $2,060 | $51,280 | $8,000 | $43,280 |
| 2020 | $1,875 | $46,000 | $8,000 | $38,000 |
| 2019 | $2,068 | $50,073 | $6,400 | $43,673 |
| 2018 | $2,182 | $52,894 | $6,400 | $46,494 |
| 2017 | $1,916 | $46,233 | $6,400 | $39,833 |
| 2016 | $1,832 | $44,173 | $6,400 | $37,773 |
| 2015 | $1,243 | $0 | $0 | $0 |
| 2014 | $1,079 | $26,257 | $6,400 | $19,857 |
Source: Public Records
Map
Nearby Homes
- 2117 Amish Ct
- 6495 Revena Dr
- 6532 Debbie Sue Ln
- 6541 Debbie Sue Ln
- 1893 Stratford Arms Dr
- 6633 Cameron Rd
- 6566 Melandre Dr
- 1924 Mural Cir
- 1802 Lake Harbin Rd
- 1804 Carla Dr
- 2275 Santa fe St Unit 25
- 6359 Lanier Rd
- 6463 Maddox Rd
- 6413 Maddox Rd
- 6186 Deans Way
- 6168 Deans Way
- 6560 Maddox Rd
- 1931 Cornell Way
- 2144 Carriage Dr
- 2455 Lake Harbin Rd
- 2046 Pinecrest Dr
- 2068 Pinecrest Dr
- 6447 Heritage Run
- 6451 Heritage Run
- 6443 Heritage Run
- 2036 Pinecrest Dr
- 6439 Heritage Run
- 2067 Pinecrest Dr
- 2055 Pinecrest Dr
- 6455 Heritage Run
- 2045 Pinecrest Dr
- 6435 Heritage Run
- 2080 Pinecrest Dr
- 2026 Pinecrest Dr
- 6489 Lynn Dale Ln
- 2035 Pinecrest Dr
- 6489 Lynndale Ln
- 6459 Heritage Run
- 6446 Heritage Run
- 6474 Lynndale Ln
Your Personal Tour Guide
Ask me questions while you tour the home.