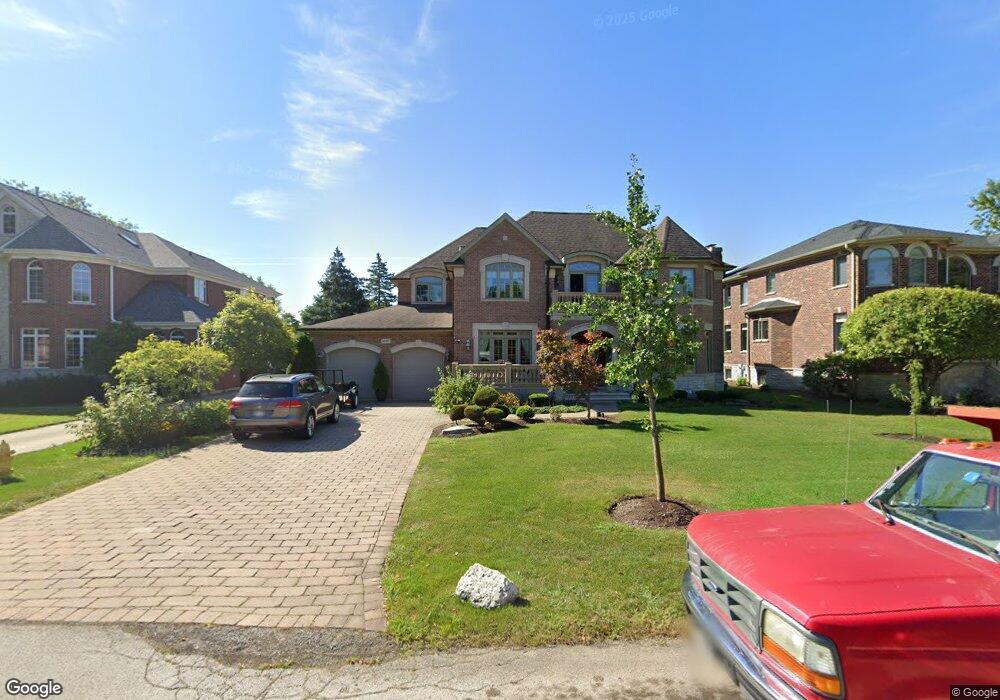
2057 De Cook Ave Park Ridge, IL 60068
Estimated Value: $1,331,000 - $1,842,000
4
Beds
5
Baths
4,339
Sq Ft
$346/Sq Ft
Est. Value
About This Home
This home is located at 2057 De Cook Ave, Park Ridge, IL 60068 and is currently estimated at $1,502,261, approximately $346 per square foot. 2057 De Cook Ave is a home located in Cook County with nearby schools including Franklin Elementary School, Emerson Middle School, and Maine East High School.
Ownership History
Date
Name
Owned For
Owner Type
Purchase Details
Closed on
Jul 6, 2013
Sold by
Lamarc Vito La and Lamarca Rosa La
Bought by
Lamarca Vito La and Lamarca Rosa La
Current Estimated Value
Purchase Details
Closed on
Aug 31, 2004
Sold by
Parkway Bank & Trust Co
Bought by
Lamarca Vito and Lamarca Rosa
Home Financials for this Owner
Home Financials are based on the most recent Mortgage that was taken out on this home.
Original Mortgage
$555,000
Outstanding Balance
$267,962
Interest Rate
5.5%
Mortgage Type
Unknown
Estimated Equity
$1,234,299
Purchase Details
Closed on
Aug 30, 1995
Sold by
Humphreys Stephanie and Skowron Stephanie
Bought by
Parkway Bank & Trust Company
Purchase Details
Closed on
Nov 23, 1993
Sold by
Skowron Stanley and Humphreys Stephanie
Bought by
Humphreys Stephanie
Create a Home Valuation Report for This Property
The Home Valuation Report is an in-depth analysis detailing your home's value as well as a comparison with similar homes in the area
Home Values in the Area
Average Home Value in this Area
Purchase History
| Date | Buyer | Sale Price | Title Company |
|---|---|---|---|
| Lamarca Vito La | -- | None Available | |
| Lamarca Vito | -- | Cti | |
| Parkway Bank & Trust Company | $190,000 | Intercounty Title | |
| Humphreys Stephanie | -- | -- |
Source: Public Records
Mortgage History
| Date | Status | Borrower | Loan Amount |
|---|---|---|---|
| Open | Lamarca Vito | $555,000 |
Source: Public Records
Tax History Compared to Growth
Tax History
| Year | Tax Paid | Tax Assessment Tax Assessment Total Assessment is a certain percentage of the fair market value that is determined by local assessors to be the total taxable value of land and additions on the property. | Land | Improvement |
|---|---|---|---|---|
| 2024 | $22,805 | $87,339 | $11,840 | $75,499 |
| 2023 | $22,776 | $91,000 | $11,840 | $79,160 |
| 2022 | $22,776 | $91,000 | $11,840 | $79,160 |
| 2021 | $23,808 | $81,609 | $9,472 | $72,137 |
| 2020 | $22,930 | $81,609 | $9,472 | $72,137 |
| 2019 | $23,005 | $91,696 | $9,472 | $82,224 |
| 2018 | $20,983 | $76,757 | $8,288 | $68,469 |
| 2017 | $22,814 | $83,439 | $8,288 | $75,151 |
| 2016 | $22,209 | $83,439 | $8,288 | $75,151 |
| 2015 | $21,268 | $79,660 | $6,808 | $72,852 |
| 2014 | $19,079 | $79,660 | $6,808 | $72,852 |
| 2013 | $22,421 | $80,918 | $6,808 | $74,110 |
Source: Public Records
Map
Nearby Homes
- 2200 Walnut St
- 1819 Glenview Ave
- 1712 Woodland Ave
- 8253 N Western Ave
- 1720 Greendale Ave
- 1035 N Dee Rd
- 1316 N Northwest Hwy
- 8619 W Park Ln
- 2308 Oakton St
- 1044 N Knight Ave
- 1057 Busse Hwy
- 1815 Oakton St Unit 2A
- 1710 Dempster St Unit A
- 1717 Oakton St
- 900 Rowe Ave
- 1100 Potter Rd
- 8810 Briar Ct Unit 1B
- 2200 Bouterse St Unit 409B
- 1241 Elliott St
- 1025 N Knight Ave
- 2081 De Cook Ave
- 2037 De Cook Ave
- 2060 Manor Ln
- 2040 Manor Ln
- 2017 De Cook Ave
- 2101 De Cook Ave
- 2080 Manor Ln
- 2016 Manor Ln
- 2052 De Cook Ave
- 2100 Manor Ln
- 2072 De Cook Ave
- 2032 De Cook Ave
- 1426 Vernon Ave
- 2000 Manor Ln
- 2092 De Cook Ave
- 2012 De Cook Ave
- 2119 De Cook Ave Unit 2
- 2124 Manor Ln
- 2116 De Cook Ave
- 2011 Manor Ln