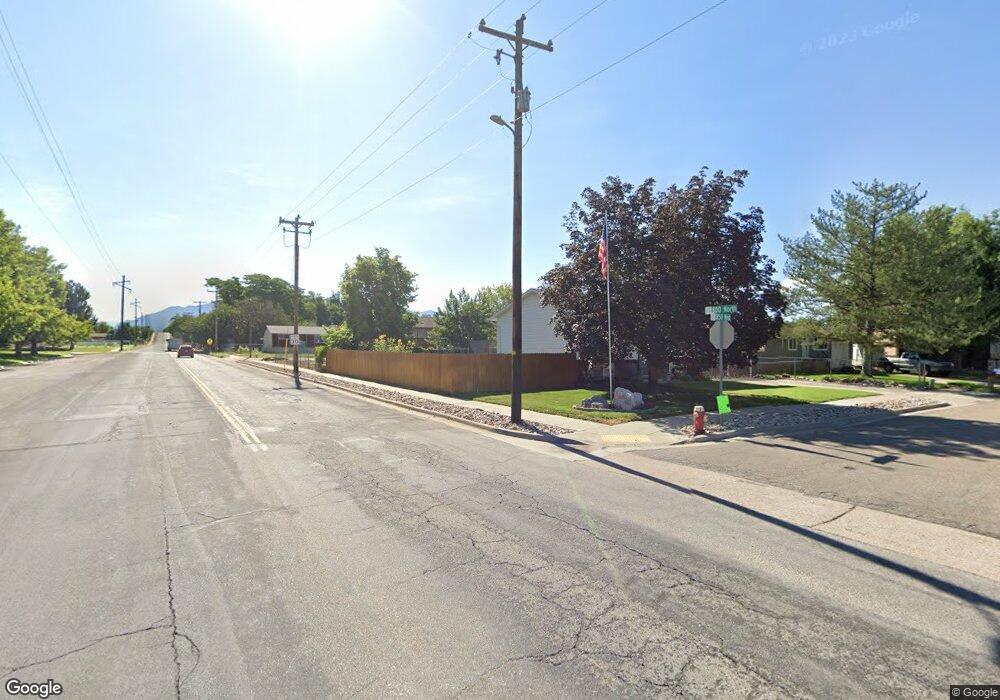
2057 N 850 W Clearfield, UT 84015
Estimated Value: $421,965 - $481,000
3
Beds
2
Baths
1,420
Sq Ft
$314/Sq Ft
Est. Value
About This Home
This home is located at 2057 N 850 W, Clearfield, UT 84015 and is currently estimated at $445,991, approximately $314 per square foot. 2057 N 850 W is a home located in Davis County with nearby schools including Fremont School, Sunset Junior High School, and Northridge High School.
Ownership History
Date
Name
Owned For
Owner Type
Purchase Details
Closed on
Aug 25, 1998
Sold by
Garrett Jon R and Garrett Jody Lynn
Bought by
Maass Edward H and Graham Donna
Current Estimated Value
Home Financials for this Owner
Home Financials are based on the most recent Mortgage that was taken out on this home.
Original Mortgage
$123,000
Outstanding Balance
$34,365
Interest Rate
10.75%
Estimated Equity
$411,626
Purchase Details
Closed on
Nov 22, 1996
Sold by
Mt Ogden Real Estate Inc
Bought by
Garrett Jon R and Garrett Jody Lynn
Home Financials for this Owner
Home Financials are based on the most recent Mortgage that was taken out on this home.
Original Mortgage
$110,394
Interest Rate
7.88%
Mortgage Type
FHA
Create a Home Valuation Report for This Property
The Home Valuation Report is an in-depth analysis detailing your home's value as well as a comparison with similar homes in the area
Home Values in the Area
Average Home Value in this Area
Purchase History
| Date | Buyer | Sale Price | Title Company |
|---|---|---|---|
| Maass Edward H | -- | Avis & Archibald Title Ins | |
| Garrett Jon R | -- | Bonneville Title Company Inc |
Source: Public Records
Mortgage History
| Date | Status | Borrower | Loan Amount |
|---|---|---|---|
| Open | Maass Edward H | $123,000 | |
| Previous Owner | Garrett Jon R | $110,394 | |
| Closed | Maass Edward H | $3,000 |
Source: Public Records
Tax History Compared to Growth
Tax History
| Year | Tax Paid | Tax Assessment Tax Assessment Total Assessment is a certain percentage of the fair market value that is determined by local assessors to be the total taxable value of land and additions on the property. | Land | Improvement |
|---|---|---|---|---|
| 2025 | $2,282 | $219,450 | $88,773 | $130,677 |
| 2024 | $2,208 | $213,400 | $97,742 | $115,658 |
| 2023 | $2,018 | $361,000 | $110,923 | $250,077 |
| 2022 | $2,146 | $212,300 | $68,201 | $144,099 |
| 2021 | $1,949 | $286,000 | $84,789 | $201,211 |
| 2020 | $1,687 | $245,000 | $71,735 | $173,265 |
| 2019 | $1,628 | $231,000 | $84,406 | $146,594 |
| 2018 | $1,506 | $210,000 | $71,368 | $138,632 |
| 2016 | $1,394 | $100,320 | $27,726 | $72,594 |
| 2015 | $1,306 | $89,375 | $27,726 | $61,649 |
| 2014 | $1,240 | $86,209 | $27,726 | $58,483 |
| 2013 | -- | $90,412 | $27,143 | $63,269 |
Source: Public Records
Map
Nearby Homes