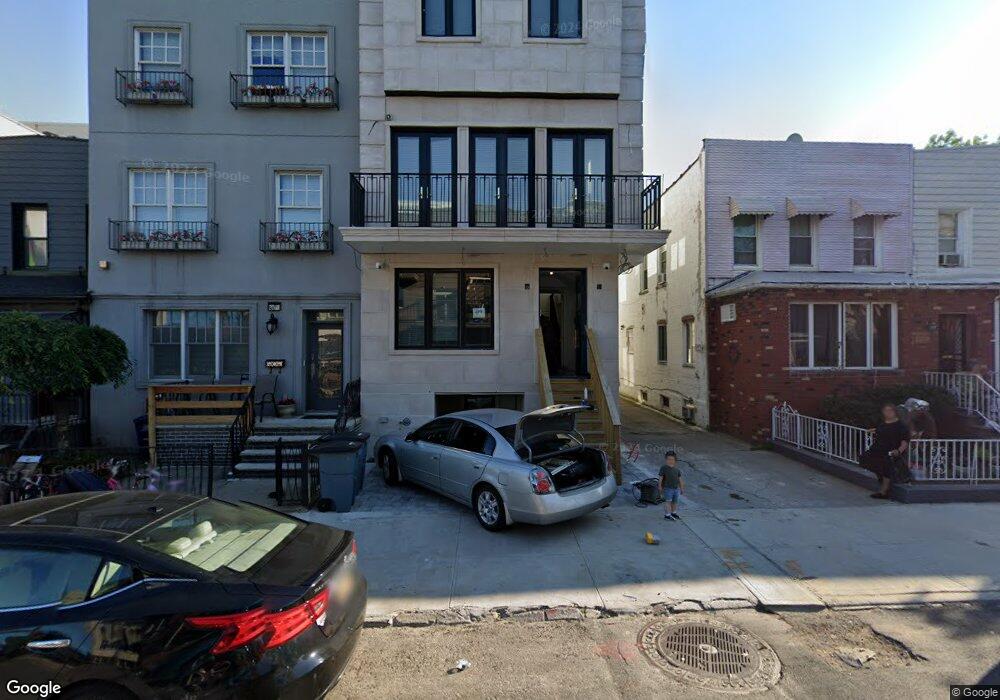
2058 58th St Brooklyn, NY 11204
Borough Park NeighborhoodEstimated Value: $1,699,000 - $3,920,146
--
Bed
--
Bath
4,009
Sq Ft
$712/Sq Ft
Est. Value
About This Home
This home is located at 2058 58th St, Brooklyn, NY 11204 and is currently estimated at $2,856,049, approximately $712 per square foot. 2058 58th St is a home located in Kings County with nearby schools including P.S. 121 Nelson A Rockefeller, Franklin Delano Roosevelt High School, and Barkai Yeshivah.
Ownership History
Date
Name
Owned For
Owner Type
Purchase Details
Closed on
Jun 30, 2011
Sold by
Moster Blima and Moster Elimelech
Bought by
Stern Miriam
Current Estimated Value
Purchase Details
Closed on
Apr 20, 2005
Sold by
Cheung Yun Ho and Li Ho Man
Bought by
Moster Blima and Moster Elimelech
Home Financials for this Owner
Home Financials are based on the most recent Mortgage that was taken out on this home.
Original Mortgage
$95,000
Interest Rate
6.01%
Create a Home Valuation Report for This Property
The Home Valuation Report is an in-depth analysis detailing your home's value as well as a comparison with similar homes in the area
Home Values in the Area
Average Home Value in this Area
Purchase History
| Date | Buyer | Sale Price | Title Company |
|---|---|---|---|
| Stern Miriam | $225,000 | -- | |
| Stern Miriam | $225,000 | -- | |
| Moster Blima | $600,000 | -- | |
| Moster Blima | $600,000 | -- |
Source: Public Records
Mortgage History
| Date | Status | Borrower | Loan Amount |
|---|---|---|---|
| Previous Owner | Moster Blima | $95,000 | |
| Previous Owner | Moster Blima | $445,000 |
Source: Public Records
Tax History Compared to Growth
Tax History
| Year | Tax Paid | Tax Assessment Tax Assessment Total Assessment is a certain percentage of the fair market value that is determined by local assessors to be the total taxable value of land and additions on the property. | Land | Improvement |
|---|---|---|---|---|
| 2025 | $15,219 | $182,760 | $45,000 | $137,760 |
| 2024 | $15,219 | $153,720 | $45,000 | $108,720 |
| 2023 | $15,111 | $148,620 | $45,000 | $103,620 |
| 2022 | $14,596 | $162,840 | $45,000 | $117,840 |
| 2021 | $15,387 | $130,380 | $45,000 | $85,380 |
| 2020 | $7,632 | $108,960 | $45,000 | $63,960 |
| 2019 | $4,216 | $40,980 | $16,440 | $24,540 |
| 2018 | $3,876 | $19,016 | $11,039 | $7,977 |
| 2017 | $3,657 | $17,940 | $16,440 | $1,500 |
| 2016 | $5,372 | $26,872 | $10,609 | $16,263 |
| 2015 | $3,221 | $26,872 | $15,893 | $10,979 |
| 2014 | $3,221 | $25,975 | $13,271 | $12,704 |
Source: Public Records
Map
Nearby Homes