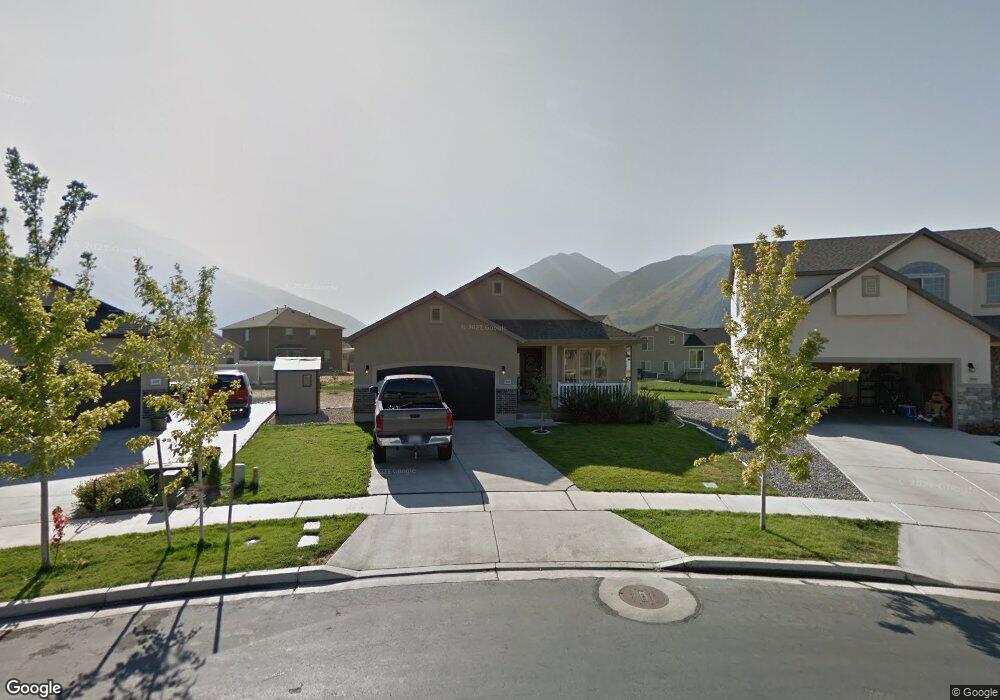
2058 E 1330 S Spanish Fork, UT 84660
Estimated Value: $549,000 - $703,000
3
Beds
2
Baths
3,152
Sq Ft
$187/Sq Ft
Est. Value
About This Home
This home is located at 2058 E 1330 S, Spanish Fork, UT 84660 and is currently estimated at $590,491, approximately $187 per square foot. 2058 E 1330 S is a home located in Utah County with nearby schools including East Meadows Elementary School, Spanish Fork Jr High School, and Spanish Fork High School.
Ownership History
Date
Name
Owned For
Owner Type
Purchase Details
Closed on
Apr 13, 2021
Sold by
Durden Living Trust and Durden Orville D
Bought by
Durden Lloyd and Evans Alyssa
Current Estimated Value
Home Financials for this Owner
Home Financials are based on the most recent Mortgage that was taken out on this home.
Original Mortgage
$155,000
Outstanding Balance
$139,946
Interest Rate
3%
Mortgage Type
New Conventional
Estimated Equity
$450,545
Purchase Details
Closed on
Feb 25, 2011
Sold by
Jenne Luke R and Jenne Natalie A
Bought by
Durden Orville
Purchase Details
Closed on
Feb 23, 2011
Sold by
Durden Orville
Bought by
Durden Orville D and Durden Kay
Purchase Details
Closed on
Feb 11, 2008
Sold by
Spanish Vista Plat I Llc
Bought by
Jenne Luke R and Jenne Natalie A
Home Financials for this Owner
Home Financials are based on the most recent Mortgage that was taken out on this home.
Original Mortgage
$221,769
Interest Rate
6.04%
Mortgage Type
FHA
Create a Home Valuation Report for This Property
The Home Valuation Report is an in-depth analysis detailing your home's value as well as a comparison with similar homes in the area
Home Values in the Area
Average Home Value in this Area
Purchase History
| Date | Buyer | Sale Price | Title Company |
|---|---|---|---|
| Durden Lloyd | -- | Silver Leaf Title | |
| Durden Lloyd | -- | Silver Leaf Title Insurance | |
| Durden Orville | -- | Cornerstone Title Insuranc | |
| Durden Orville D | -- | Accommodation | |
| Jenne Luke R | -- | First American Orem |
Source: Public Records
Mortgage History
| Date | Status | Borrower | Loan Amount |
|---|---|---|---|
| Open | Durden Lloyd | $155,000 | |
| Closed | Durden Lloyd | $155,000 | |
| Previous Owner | Jenne Luke R | $221,769 |
Source: Public Records
Tax History Compared to Growth
Tax History
| Year | Tax Paid | Tax Assessment Tax Assessment Total Assessment is a certain percentage of the fair market value that is determined by local assessors to be the total taxable value of land and additions on the property. | Land | Improvement |
|---|---|---|---|---|
| 2025 | $2,511 | $274,120 | $204,000 | $294,400 |
| 2024 | $2,511 | $258,830 | $0 | $0 |
| 2023 | $2,587 | $266,970 | $0 | $0 |
| 2022 | $2,663 | $269,555 | $0 | $0 |
| 2021 | $2,274 | $368,100 | $121,900 | $246,200 |
| 2020 | $2,152 | $338,800 | $110,800 | $228,000 |
| 2019 | $1,921 | $318,200 | $92,300 | $225,900 |
| 2018 | $1,833 | $293,500 | $87,100 | $206,400 |
| 2017 | $1,683 | $144,815 | $0 | $0 |
| 2016 | $1,560 | $132,440 | $0 | $0 |
| 2015 | $1,387 | $116,380 | $0 | $0 |
| 2014 | $1,228 | $103,400 | $0 | $0 |
Source: Public Records
Map
Nearby Homes
- 1931 E 1400 S
- 417 E 1460 S Unit 48
- 332 E 1460 S Unit 56
- 1246 S 2130 E
- 1236 S 2130 E
- 1547 S 2120 E
- 1184 S 2300 E
- 357 E 1460 S Unit 45
- 385 E 1460 S Unit 47
- 379 E 1460 S Unit 46
- 1093 S 1960 E
- 2012 E 1630 S
- 1503 S 3740 E Unit 1320
- 3509 E 1120 S Unit 109
- 3462 E 1120 S Unit 117
- 1591 E 1550 S
- 1112 S 1660 E
- 938 S 1740 E
- 2064 E 800 S
- 1033 S 1560 E
- 1329 S 2060 E
- 2054 E 1330 S
- 2054 E 1330 S Unit 220
- 2067 E 1400 S
- 2079 E 1400 S
- 1342 S 2130 E
- 2053 E 1400 S
- 1317 S 2060 E
- 1328 S 2130 E
- 2091 E 1400 S
- 2046 E 1330 S Unit 219
- 2046 E 1330 S
- 1318 S 2130 E
- 1324 S 2060 E
- 2041 E 1400 S
- 2117 E 1400 S
- 2026 E 1330 S Unit 218
- 1297 S 2060 E
- 1987 S 2130 E Unit 42
- 1296 S 2130 E