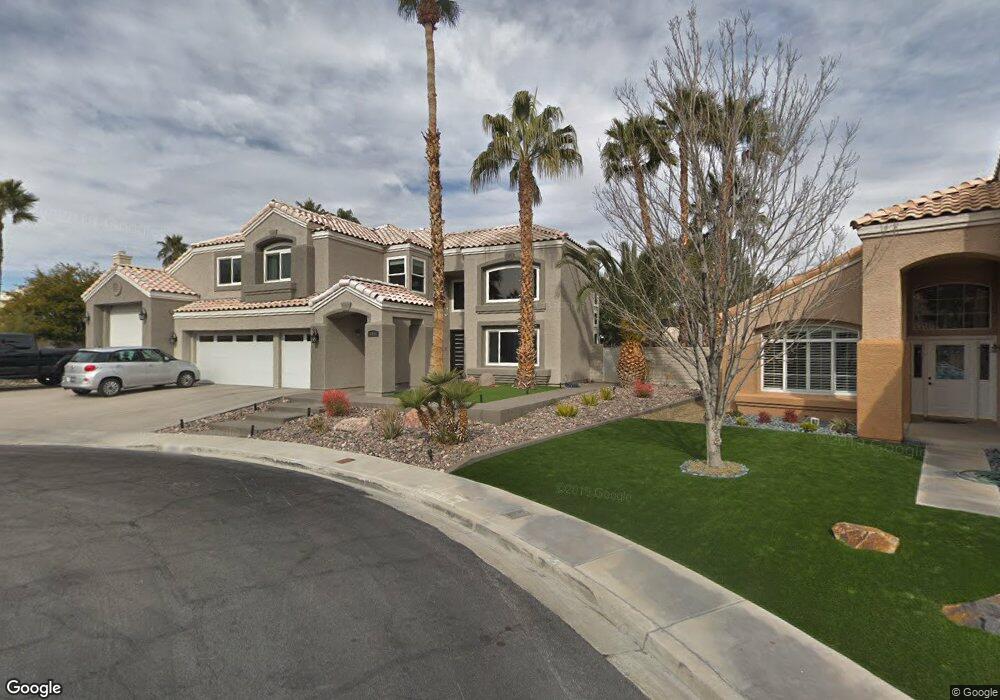
2058 Lost Pines Cir Unit 1 Henderson, NV 89074
Green Valley South NeighborhoodEstimated Value: $837,000 - $1,055,000
5
Beds
4
Baths
3,425
Sq Ft
$270/Sq Ft
Est. Value
About This Home
This home is located at 2058 Lost Pines Cir Unit 1, Henderson, NV 89074 and is currently estimated at $923,183, approximately $269 per square foot. 2058 Lost Pines Cir Unit 1 is a home located in Clark County with nearby schools including Selma F Bartlett Elementary School, Barbara and Hank Greenspun Junior High School, and Coronado High School.
Ownership History
Date
Name
Owned For
Owner Type
Purchase Details
Closed on
Apr 7, 2014
Sold by
Kiefer Tricia L
Bought by
Kiefer Tricia Lynne and The Tricia Lynne Kiefer Revocable Living
Current Estimated Value
Purchase Details
Closed on
Feb 20, 2008
Sold by
Kiefer Stephen P
Bought by
Kiefer Tricia L
Home Financials for this Owner
Home Financials are based on the most recent Mortgage that was taken out on this home.
Original Mortgage
$75,000
Outstanding Balance
$14,324
Interest Rate
5.85%
Mortgage Type
Credit Line Revolving
Estimated Equity
$908,859
Purchase Details
Closed on
Jul 29, 2004
Sold by
Keefe Stephen Duval and Henry Keefe Carey
Bought by
Kiefer Stephen P and Kiefer Tricia L
Home Financials for this Owner
Home Financials are based on the most recent Mortgage that was taken out on this home.
Original Mortgage
$460,000
Outstanding Balance
$226,137
Interest Rate
5.87%
Mortgage Type
Unknown
Estimated Equity
$697,046
Create a Home Valuation Report for This Property
The Home Valuation Report is an in-depth analysis detailing your home's value as well as a comparison with similar homes in the area
Home Values in the Area
Average Home Value in this Area
Purchase History
| Date | Buyer | Sale Price | Title Company |
|---|---|---|---|
| Kiefer Tricia Lynne | -- | None Available | |
| Kiefer Tricia L | -- | Ticor Title Of Nevada Inc | |
| Kiefer Stephen P | $585,000 | Ticor Title Of Nevada Inc |
Source: Public Records
Mortgage History
| Date | Status | Borrower | Loan Amount |
|---|---|---|---|
| Open | Kiefer Tricia L | $75,000 | |
| Open | Kiefer Stephen P | $460,000 |
Source: Public Records
Tax History Compared to Growth
Tax History
| Year | Tax Paid | Tax Assessment Tax Assessment Total Assessment is a certain percentage of the fair market value that is determined by local assessors to be the total taxable value of land and additions on the property. | Land | Improvement |
|---|---|---|---|---|
| 2025 | $3,927 | $173,706 | $65,450 | $108,256 |
| 2024 | $3,813 | $173,706 | $65,450 | $108,256 |
| 2023 | $3,813 | $163,082 | $59,098 | $103,984 |
| 2022 | $3,702 | $144,623 | $48,972 | $95,651 |
| 2021 | $3,595 | $136,619 | $45,045 | $91,574 |
| 2020 | $3,487 | $132,790 | $41,580 | $91,210 |
| 2019 | $3,443 | $128,185 | $37,730 | $90,455 |
| 2018 | $3,175 | $115,786 | $32,340 | $83,446 |
| 2017 | $3,283 | $113,255 | $28,000 | $85,255 |
| 2016 | $2,972 | $111,471 | $25,900 | $85,571 |
| 2015 | $2,966 | $104,978 | $20,650 | $84,328 |
| 2014 | $2,880 | $96,452 | $14,700 | $81,752 |
Source: Public Records
Map
Nearby Homes
- 30 Daisy Meadow Terrace Unit 1
- 7 Barton Spring Cir
- 2008 Spruce Brook Dr
- 95 Callaway Cir Unit 3
- 95 Arthur Hills Ct
- 114 Weatherwood Ct
- 1966 Windfall Ave
- 1910 Grey Eagle St
- 87 Ginger Lily Terrace
- 2090 Eaglepath Cir
- 2107 Eaglepath Cir
- 2084 Eaglepath Cir
- 104 Augusta Place
- 2005 Summerside Ct
- 2032 Troon Dr
- 251 Chestnut Ridge Cir
- 20 Staghorn St
- 2058 Troon Dr
- 79 Magical Mystery Ln
- 208 Sandpiper Village Way
- 2056 Lost Pines Cir
- 12 Cozy Glen Cir
- 10 Cozy Glen Cir
- 2067 Majestic Peak Dr
- 2054 Lost Pines Cir
- 2057 Majestic Peak Dr
- 2069 Majestic Peak Dr
- 2065 Majestic Peak Dr
- 2055 Majestic Peak Dr
- 2057 Lost Pines Cir
- 2052 Lost Pines Cir
- 8 Cozy Glen Cir
- 2053 Majestic Peak Dr
- 2055 Lost Pines Cir
- 15 Cozy Glen Cir
- 2050 Lost Pines Cir Unit 1
- 2053 Lost Pines Cir
- 7 Cozy Glen Cir
- 11 Cozy Glen Cir
- 2051 Majestic Peak Dr