2058 Phillips Mill Rd Forest Hill, MD 21050
Estimated Value: $757,000 - $965,000
4
Beds
4
Baths
4,446
Sq Ft
$195/Sq Ft
Est. Value
About This Home
This home is located at 2058 Phillips Mill Rd, Forest Hill, MD 21050 and is currently estimated at $868,219, approximately $195 per square foot. 2058 Phillips Mill Rd is a home located in Harford County with nearby schools including Jarrettsville Elementary School, Fallston Middle School, and Fallston High School.
Ownership History
Date
Name
Owned For
Owner Type
Purchase Details
Closed on
Jan 10, 2017
Sold by
Moultrup Karen E and Rappold Marie E
Bought by
Moultrup Karen E and Moultrup Paul D
Current Estimated Value
Purchase Details
Closed on
Sep 8, 2009
Sold by
Duck Shores Maryland Llc
Bought by
Moultrup Karen E and Rappold Marie E
Purchase Details
Closed on
Jun 27, 2006
Sold by
St Clair Charles A
Bought by
Katen John F
Purchase Details
Closed on
May 19, 2006
Sold by
St Clair Charles A
Bought by
Katen John F
Purchase Details
Closed on
Apr 19, 2006
Sold by
St Clair Matthew G
Bought by
St Clair Charles A and St Clair Jocelyn F
Purchase Details
Closed on
Apr 5, 2006
Sold by
St Clair Charles Albert
Bought by
St Clair Matthew G
Purchase Details
Closed on
Apr 4, 2006
Sold by
St Clair Matthew G
Bought by
St Clair Charles A and St Clair Jocelyn F
Create a Home Valuation Report for This Property
The Home Valuation Report is an in-depth analysis detailing your home's value as well as a comparison with similar homes in the area
Purchase History
| Date | Buyer | Sale Price | Title Company |
|---|---|---|---|
| Moultrup Karen E | -- | None Available | |
| Moultrup Karen E | $559,900 | -- | |
| Katen John F | $400,000 | -- | |
| Katen John F | $400,000 | -- | |
| St Clair Charles A | -- | -- | |
| St Clair Matthew G | -- | -- | |
| St Clair Matthew G | -- | -- | |
| St Clair Charles A | -- | -- |
Source: Public Records
Mortgage History
| Date | Status | Borrower | Loan Amount |
|---|---|---|---|
| Closed | Katen John F | -- |
Source: Public Records
Tax History
| Year | Tax Paid | Tax Assessment Tax Assessment Total Assessment is a certain percentage of the fair market value that is determined by local assessors to be the total taxable value of land and additions on the property. | Land | Improvement |
|---|---|---|---|---|
| 2025 | $7,493 | $709,900 | $0 | $0 |
| 2024 | $7,493 | $682,000 | $141,400 | $540,600 |
| 2023 | $7,190 | $654,233 | $0 | $0 |
| 2022 | $6,888 | $626,467 | $0 | $0 |
| 2021 | $6,793 | $598,700 | $131,400 | $467,300 |
| 2020 | $6,793 | $583,467 | $0 | $0 |
| 2019 | $6,617 | $568,233 | $0 | $0 |
| 2018 | $6,384 | $553,000 | $141,400 | $411,600 |
| 2017 | $6,216 | $553,000 | $0 | $0 |
| 2016 | -- | $523,600 | $0 | $0 |
| 2015 | $5,884 | $508,900 | $0 | $0 |
| 2014 | $5,884 | $508,900 | $0 | $0 |
Source: Public Records
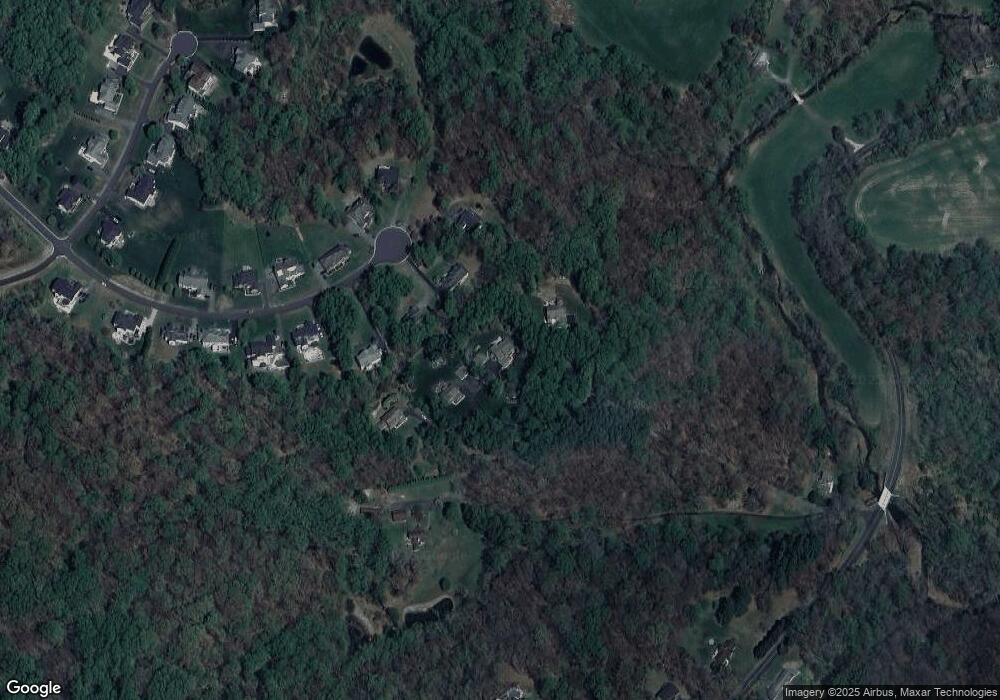
Map
Nearby Homes
- 1705 Moonriver Ct
- 1613 Rushing Stream Ct
- 1906 Parkwood Dr
- 1913 Trout Farm Rd
- 1229 W Jarrettsville Rd
- 2033 Packard Dr
- 1775 Pleasantville Rd
- 1932 Pleasantville Rd
- 3006 Charles St
- 1701 Ingleside Rd
- 2301 Victorian View Ct
- 2016 Durham Rd
- 2401 Scotlon Ct
- 600 Rock Spring Church Rd
- 2210 Pleasantville Rd
- 2705 Fallston Rd
- 2005 Pearlstone Dr
- 1814 Ridgecroft Dr
- 1702 Lasalle Rd
- 3203 Glouchester Dr
- 2056 Phillips Mill Rd
- 2060 Phillips Mill Rd
- 1824 Morning Brook Dr
- 1822 Morning Brook Dr
- 2054 Phillips Mill Rd
- 1826 Morning Brook Dr
- 1820 Morning Brook Dr
- 1821 Morning Brook Dr
- 1818 Morning Brook Dr
- 2052 Phillips Mill Rd
- 1825 Morning Brook Dr
- 1823 Morning Brook Dr
- 1819 Morning Brook Dr
- 1816 Morning Brook Dr
- 1817 Morning Brook Dr
- 1814 Morning Brook Dr
- 1815 Morning Brook Dr
- 1812 Morning Brook Dr
- 2022 Phillips Mill Rd
- 2062 Phillips Mill Rd
Your Personal Tour Guide
Ask me questions while you tour the home.