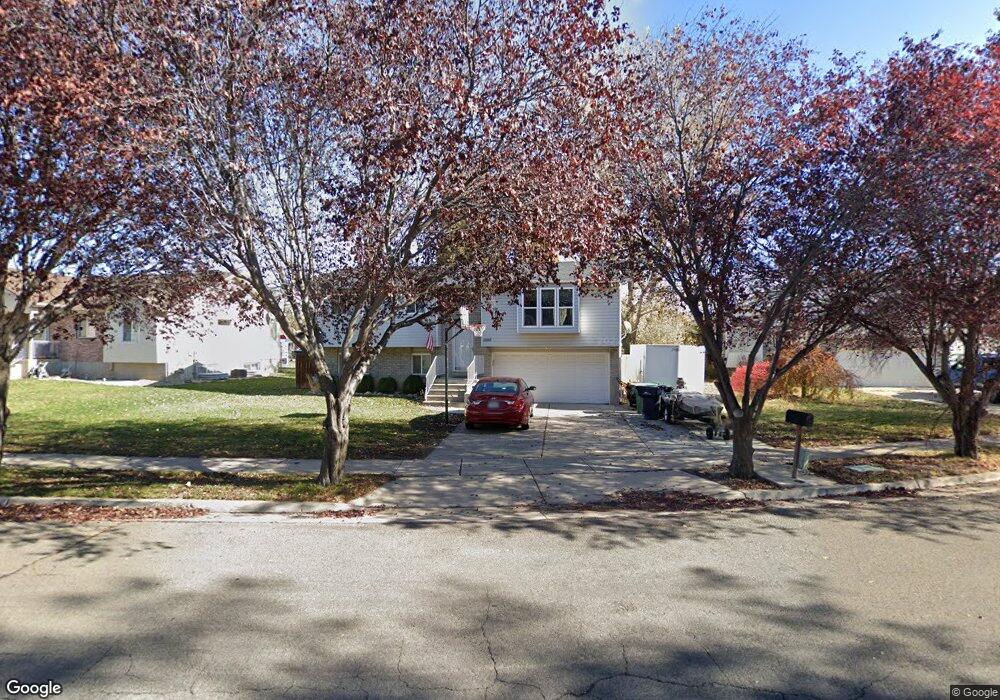
2058 S 50 W Clearfield, UT 84015
Estimated Value: $413,000 - $436,000
4
Beds
2
Baths
1,671
Sq Ft
$256/Sq Ft
Est. Value
About This Home
This home is located at 2058 S 50 W, Clearfield, UT 84015 and is currently estimated at $427,646, approximately $255 per square foot. 2058 S 50 W is a home located in Davis County with nearby schools including Antelope Elementary School, North Davis Junior High School, and Clearfield High School.
Ownership History
Date
Name
Owned For
Owner Type
Purchase Details
Closed on
Oct 24, 2019
Sold by
Tobler Jared K and Tobler April A
Bought by
Minson Scott B
Current Estimated Value
Home Financials for this Owner
Home Financials are based on the most recent Mortgage that was taken out on this home.
Original Mortgage
$278,910
Outstanding Balance
$244,339
Interest Rate
3.5%
Mortgage Type
VA
Estimated Equity
$183,307
Purchase Details
Closed on
Jul 28, 2005
Sold by
Boelter Tyler J and Boelter Tina M
Bought by
Tobler Jared I and Tobler April A
Home Financials for this Owner
Home Financials are based on the most recent Mortgage that was taken out on this home.
Original Mortgage
$129,730
Interest Rate
5.56%
Mortgage Type
VA
Purchase Details
Closed on
Jan 29, 1998
Sold by
Minert Daniel G and Minert Deborah
Bought by
Boelter Tyler J and Boelter Tina M
Home Financials for this Owner
Home Financials are based on the most recent Mortgage that was taken out on this home.
Original Mortgage
$108,333
Interest Rate
7.05%
Mortgage Type
FHA
Create a Home Valuation Report for This Property
The Home Valuation Report is an in-depth analysis detailing your home's value as well as a comparison with similar homes in the area
Home Values in the Area
Average Home Value in this Area
Purchase History
| Date | Buyer | Sale Price | Title Company |
|---|---|---|---|
| Minson Scott B | -- | Stewart Title Ins Agen | |
| Tobler Jared I | -- | First American Title | |
| Boelter Tyler J | -- | Bonneville Title Company Inc |
Source: Public Records
Mortgage History
| Date | Status | Borrower | Loan Amount |
|---|---|---|---|
| Open | Minson Scott B | $278,910 | |
| Previous Owner | Tobler Jared I | $129,730 | |
| Previous Owner | Boelter Tyler J | $108,333 |
Source: Public Records
Tax History Compared to Growth
Tax History
| Year | Tax Paid | Tax Assessment Tax Assessment Total Assessment is a certain percentage of the fair market value that is determined by local assessors to be the total taxable value of land and additions on the property. | Land | Improvement |
|---|---|---|---|---|
| 2025 | $2,578 | $231,000 | $76,666 | $154,334 |
| 2024 | $2,504 | $226,050 | $73,264 | $152,786 |
| 2023 | $2,288 | $379,000 | $116,798 | $262,202 |
| 2022 | $2,480 | $222,200 | $66,466 | $155,734 |
| 2021 | $2,290 | $310,000 | $72,922 | $237,078 |
| 2020 | $1,986 | $267,000 | $61,753 | $205,247 |
| 2019 | $1,755 | $233,000 | $63,159 | $169,841 |
| 2018 | $1,585 | $205,000 | $56,060 | $148,940 |
| 2016 | $1,293 | $87,395 | $22,543 | $64,852 |
| 2015 | $1,259 | $81,180 | $22,543 | $58,637 |
| 2014 | $1,321 | $86,282 | $22,543 | $63,739 |
| 2013 | -- | $64,181 | $31,007 | $33,174 |
Source: Public Records
Map
Nearby Homes